Precious metals are rare, naturally occurring metallic elements valued for their scarcity, corrosion resistance, and density above 10 g/cm³, with eight qualifying: gold, silver, platinum, palladium, rhodium, ruthenium, iridium, and osmium. Gold crossed approximately $2,700[1] per ounce in October 2024, climbing approximately 33%[2] in twelve months and outpacing the S&P 500.
Rhodium, roughly 10× scarcer than gold, spiked to approximately $29,800[3]/oz in March 2021 before collapsing below approximately $4,500[4] by 2024, showing how rarity and industrial demand drive wildly different price behavior across the group.
This guide breaks down what precious metals actually are (gold, silver, platinum, palladium), how each one behaves in a portfolio, and the specific scenarios where they earn their keep, or quietly drag on your returns.
Quick Takeaways
- Diversify with gold, silver, platinum, and palladium—the four investment-grade precious metals.
- Allocate 5-approximately 10%[5] to gold as a hedge against inflation and market volatility.
- Avoid rhodium and osmium for portfolios—extreme price swings and low liquidity hurt returns.
- Track PGM industrial demand, especially automotive catalytic converters, before buying platinum or palladium.
- Monitor South Africa supply risks, since it produces nearly 80%[6] of global rhodium output.
What Precious Metals Are and Which Eight Qualify
Precious metals are rare, naturally occurring metallic elements with high economic value, exceptional corrosion resistance.
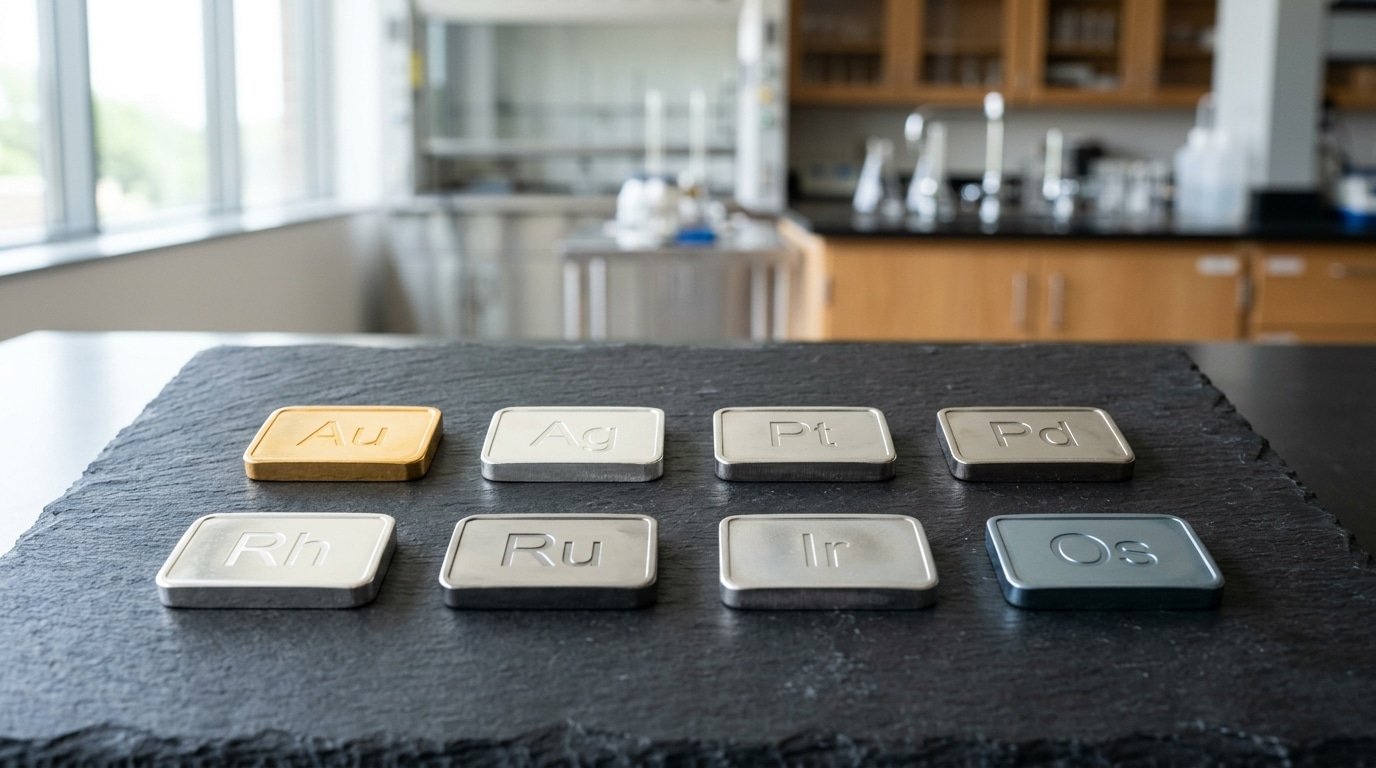
And density above 10 g/cm³. Eight metals qualify: gold, silver, platinum, palladium, rhodium, ruthenium, iridium.
And osmium. The last six form the platinum group metals (PGMs), they sit together on the periodic table and share similar chemistry.
Rarity drives the price tag. Gold’s crustal abundance is roughly 0.004 ppm; rhodium and iridium are about 0.001 ppm, making them roughly 10× scarcer than gold.
South Africa alone supplies near 80%[7] of mined rhodium, which is why rhodium spot prices spiked to approximately $29,800[8]/oz in March 2021 before collapsing below approximately $4,500 by 2024.
The PGMs behave differently from gold and silver. They have far higher melting points (iridium melts at approximately 2,466°C[10] versus gold’s approximately 1,064°C[11]) and resist acids that dissolve gold.
That’s why catalytic converters use platinum, palladium, and rhodium, not gold. Osmium is the densest natural element at 22.59 g/cm³ but is rarely traded; most “investment-grade” precious metals discussion narrows to four: gold, silver, platinum, palladium.
One naming quirk worth knowing: “poor man’s silver” refers to nickel, not a precious metal at all. The nickname stuck because pre-1965 U.S. Nickels contained a copper-nickel alloy that tarnished similarly to silver coins, fooling novice collectors.
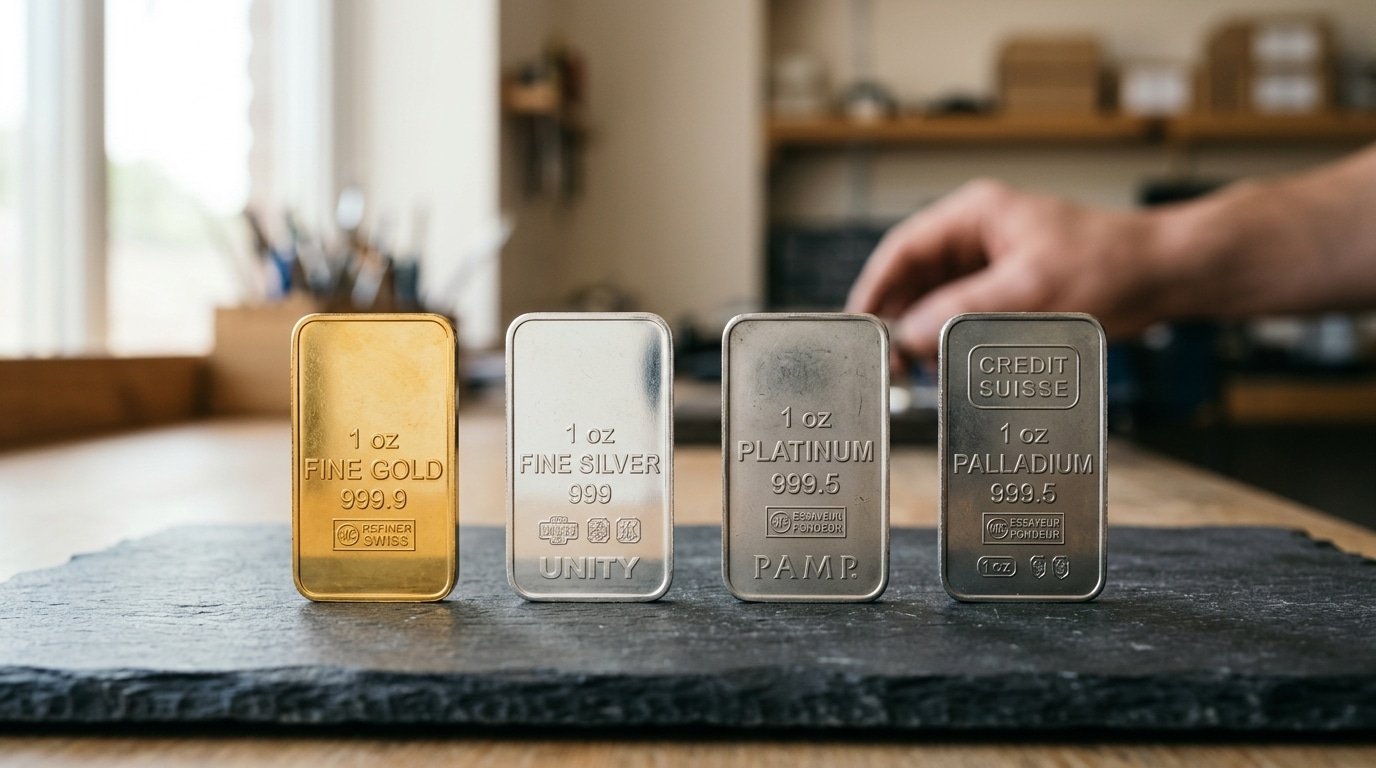
Gold, Silver, Platinum and Palladium Compared Side by Side
So the four investable Precious metals all sit next to each other on the Periodic Table, but honestly, they behave like completely different asset classes. Gold is the money metal.
Silver is roughly half industrial. Platinum and palladium are basically bets on catalytic converters, and central banks pretty much ignore them.
The way each market is built really explains why prices move the way they do.
| Metric | Gold | Silver | Platinum | Palladium |
|---|---|---|---|---|
| Above-ground stock (2024) | ~213,000 t | ~1.8M t | ~8,000 t | ~3,500 t |
| Annual mine supply | 3,000 t | 26,000 t | 180 t | 210 t |
| Industrial demand share | approximately 7%[1] | approximately 55%[2] | approximately 40%[3] | approximately 85%[4] |
| Monetary/investment demand | approximately 45%[5]+ (central banks + ETFs) | approximately 20%[6] | approximately 25%[7] | approximately 5%[8] |
| 30-day realized volatility | 12–approximately 15% | 28–35% | 22–28% | 35–55% |
| Retail bid-ask spread (coins) | 2–approximately 4% | 6–approximately 12% | 5–8% | 8–15% |
Silver’s sensitivity to gold sits somewhere near 1.8. So when gold climbs approximately 10%[10], silver usually jumps closer to approximately 18%. The reason really comes down to how much is actually available to trade.
About half of all the silver pulled out of the ground gets used up in solar panels and electronics, which leaves a thinner pool of investable metal to soak up speculative money flowing in. Palladium is actually worse.
The 2022 Russian supply shock shoved prices from $2,400 all the way to $3,440/oz in just three weeks, basically because the whole annual production could fit inside a single warehouse.
And what about platinum? It has traded at a structural discount to gold ever since 2015, which is historically pretty odd considering platinum is 15x rarer. The LBMA price benchmarks are still the global reference point for all four metals.
How Spot Prices Are Set and What Actually Moves Them
Three benchmarks anchor global precious metals pricing: the LBMA Gold and Silver Price auctions (electronic equilibrium auctions run twice daily for gold, once for silver via ICE Benchmark Administration), COMEX futures on CME Group (where the front-month contract drives intraday spot).
And the Shanghai Gold Benchmark (yuan-denominated, fixed twice daily on the SGE). Arbitrage between London, New York.
And Shanghai keeps prices tight, usually within approximately $2,3[11]/oz on gold.
What actually pushes those prices? Four measurable forces:
- Real interest rates (10-year TIPS how much usable material is produced): gold’s correlation sits near -0.7 over the past 20 years. When real yields fall, gold rises — because holding a non-yielding asset costs less.
- U.S. Dollar Index (DXY): a approximately 1%[1] DXY drop historically lifts gold roughly 0.8–approximately 1%, since metals are priced in dollars globally.
- Central bank demand: official sector net purchases topped 1,037 tonnes in 2023 and 1,045 tonnes in 2024, per the World Gold Council — the strongest two-year stretch on record, led by China, Poland, and Turkey.
- Industrial PMI: platinum and palladium track global manufacturing tightly. A sub-50 PMI print typically pulls PGM prices down 5–approximately 10%[2] within a quarter.
Practical tip: ignore the “live spot” tickers on dealer sites. Cross-check the LBMA fix against COMEX settlement before any trade over $10,000[3], retail premiums often hide a 1,approximately 2% spread above true spot.

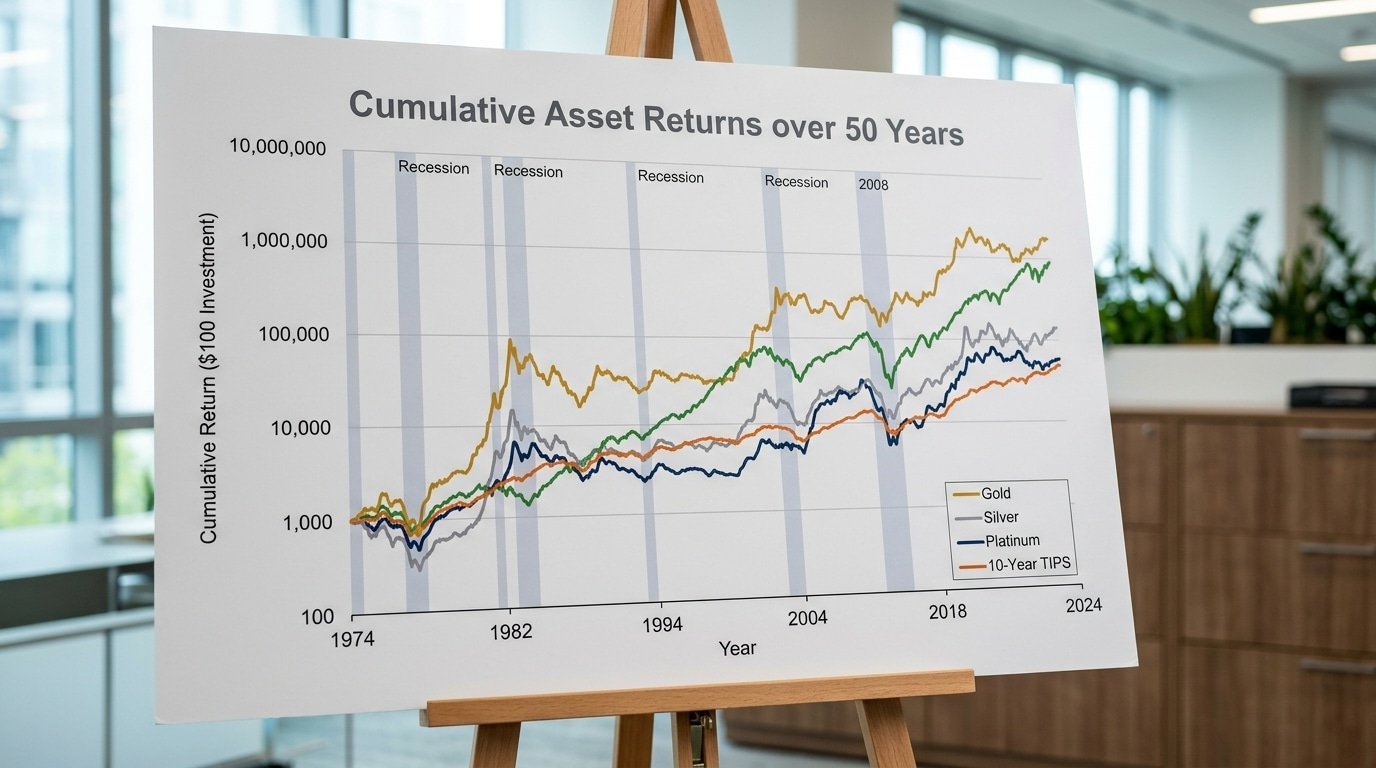
Historical Returns Versus Equities and TIPS Across 20, 50, and 100-Year Windows
Quick answer: Across the 1971,2024 fiat era, gold delivered roughly 7.8%[4] nominal CAGR versus the S&P 500’s ~approximately 10.5% total return. Silver’s 100-year real return sits near zero.
Platinum is down about 35%[5] from its 2008 peak. Precious metals lag stocks on long horizons but cushion specific decades, the 1970s, 2000s, and 2020,2024.
Three rolling windows tell three different stories
| Asset | 20-yr CAGR (2004–2024) | 50-yr CAGR (1974–2024) | 100-yr real return |
|---|---|---|---|
| Gold | ~approximately 9.3%[6] | ~approximately 7.9% | ~1.5%/yr real |
| Silver | ~6.1% | ~4.8% | ~0%/yr real |
| S&P 500 (total return) | ~approximately 10.2%[7] | ~approximately 11.1% | ~6.8%/yr real |
| 10-yr TIPS | ~3.1% | n/a (launched 1997) | n/a |
The inflation-hedge claim falls apart on shorter windows. Rolling 10-year correlation between gold and US CPI swings between -0.3 and +0.6 since 1975, per S&P Dow Jones Indices data.
Gold lost approximately 33%[8] in real terms from 1980,1999 while CPI rose 117%. TIPS, by contrast, deliver contractual inflation accrual, a structural hedge, not a behavioral one.
Platinum is the cautionary tale. It traded at approximately $2,250/oz in March 2008 and sits near $950[10] today. Anyone treating precious metals as a monolithic asset class missed that diesel-engine demand collapse entirely.
Industrial Demand Shifts Reshaping Each Metal’s Outlook
Quick answer: Industrial demand is splitting the precious metals market into two different paths. Silver and platinum are turning into bets on the energy transition, while palladium and rhodium are facing a long-term decline as gasoline cars get phased out.
And gold is increasingly becoming something central banks hold as a reserve asset rather than just a jewelry commodity.
Solar panels (the photovoltaic kind) now use up roughly 232 million ounces of silver every year, which works out to about 19%[11] of total silver demand in 2024. That’s up from less than 5% a decade ago, according to the Silver Institute’s World Silver Survey 2024.
Each TOPCon solar panel uses about 15mg[1] more silver than the older PERC designs did.
So the shift to more efficient cells is actually pushing up how much silver each panel needs, even as the number of panels being made keeps growing.
Platinum and palladium are basically swapping roles. Palladium used to rule gasoline catalytic converters, and platinum dominated the diesel side of things.
As gasoline vehicle sales shrink and carmakers swap in cheaper platinum for palladium in their three-way catalysts, palladium demand is expected to drop approximately 17%[2] by 2030 (per the Johnson Matthey PGM Market Report). Hydrogen fuel cells, which need somewhere between 30-60g of platinum each, could really pick up that slack if heavy trucking starts adopting them at scale.
Rhodium is the fragile one of the bunch. Over 80%[3] of rhodium demand comes from gasoline catalytic converters, and there’s no meaningful substitute industry for it yet. When combustion engines finally exit the stage, rhodium’s approximately $4,500[4]/oz floor essentially goes with them.
Gold’s demand picture has basically flipped. Central banks bought 1,045 tonnes in 2024 (World Gold Council), which is the third year in a row above 1,000 tonnes. This is being driven by countries diversifying their reserves away from the dollar after 2022.
The Real After-Tax, After-Cost Return Most Investors Never Calculate
Quick answer: A headline approximately 6%[5] annual return on physical precious metals typically nets out to roughly 3.0,approximately 3.5%[6] after the IRS collectibles tax, dealer spreads, storage, and assay fees. Most retail investors never run this math, and it changes which vehicle you should buy.
⚠️ Common mistake: Chasing rhodium or osmium because they’re “scarcer than gold.” Investors see the 10× rarity premium and assume bigger upside, but rhodium swung from $29,800/oz (March 2021) to under $4,500[7] by 2024, an approximately 85%[8] crash, because thin liquidity and concentrated industrial demand amplify volatility. The fix: stick to gold, silver, platinum, and palladium for portfolio allocations, capping gold at 5-approximately 10%.
The IRS classifies physical gold, silver, platinum, and palladium as “collectibles,” capping the long-term capital gains rate at approximately 28%[10] instead of the 15,approximately 20% that applies to stocks (IRS Topic 409). ETFs holding physical bullion like GLD and SLV inherit the same treatment per IRS Publication 550.
Then the friction stacks up:
- Dealer spread: 3–approximately 5%[11] on 1-oz gold coins, 6–approximately 8% on fractional or silver coins (buy-ask gap)
- IRA custodian fees: approximately $150[1]–approximately $300 per year flat, plus setup
- Insured vault storage: 0.5–approximately 1.0%[2] of asset value annually (Brink’s, Loomis, Delaware Depository)
- Assay fees on resale: approximately $30[3]–approximately $75 per bar if the chain of custody is broken
Worked example, approximately $50,000[4] in gold coins held 10 years at approximately 6%[5] gross: approximately $50K[6] grows to ~approximately $89,500. Subtract a approximately 4%[7] entry spread (approximately $2,000[8]), approximately 0.75% yearly storage (~$5,400 cumulative), and 28% collectibles tax on the approximately $39,500 gain (approximately $11,060[10]).
Net proceeds: ~approximately $71,000, an effective approximately 3.6%[11] annualized return. Hold the same exposure through a gold mining ETF in a taxable account at the approximately 15%[1] LTCG rate and the net climbs above approximately 4.7%[2].
Five Ways to Invest and Which Fits Which Investor
Quick answer: Bullion suits buy-and-hold preppers, ETFs fit IRA investors wanting one-click exposure, mining stocks reward stock-pickers comfortable with operational risk, streaming companies (Wheaton, Franco-Nevada) offer used upside without mine-level headaches, and futures belong only to accredited traders who understand margin calls.
| Vehicle | Liquidity | Counterparty Risk | Annual Cost | US Tax Treatment | Best For |
|---|---|---|---|---|---|
| Bullion coins (Eagles, Maples) | Medium — 3-approximately 8%[3] dealer spread | None if self-stored | approximately 0%[4] + storage | approximately 28%[5] collectibles rate | Long-term holders, approximately $5k-$250k |
| Allocated bars (LBMA Good Delivery) | Medium-high | Vault operator only | 0.12-approximately 0.50%[6] storage | approximately 28%[7] collectibles | HNW investors, approximately $250k+ |
| Physical ETFs (GLD, IAU, SLV, PPLT) | Very high — intraday | Trustee + custodian (HSBC, JPM) | 0.17-approximately 0.60%[8] ER | approximately 28% collectibles (still!) | IRA holders, beginners |
| Mining stocks (Newmont, Barrick) | Very high | Equity, jurisdiction, op-risk | approximately 0%[10] | 15-approximately 20% LTCG | Stock pickers wanting use |
| Streamers (Franco-Nevada, Wheaton) | High | Counterparty miners | approximately 0%[11] | 15-approximately 20% LTCG | Lower-risk equity exposure |
| Futures (COMEX GC, SI) | Extreme | Clearinghouse + broker | ~approximately $5[1] commission/contract | 60/40 Section 1256 | Accredited traders only |
Two non-obvious points. First, GLD and SLV are taxed as collectibles at approximately 28%[2], not approximately 15%[3] LTCG, because the IRS looks through the grantor trust to the underlying metal (IRS Pub 550).
Second, streaming companies historically outperform miners during flat-price environments because their costs are contractually fixed at ~approximately $400[4]/oz gold-equivalent, giving 60-approximately 70% operating margins regardless of spot.
Skip futures unless you can lose the entire margin deposit twice in a quarter without flinching. A single COMEX gold contract controls approximately 100 oz[5], roughly $260,000[6] notional at recent prices.
Portfolio Allocation Models and When Precious Metals Actually Help
Quick answer: Three frameworks bracket the credible range, Harry Browne’s Permanent Portfolio holds approximately 25%[7] gold, Ray Dalio’s All Weather allocates roughly 7.5%[8] gold plus approximately 7.5% broader commodities, and peer-reviewed Sharpe-ratio studies converge on a 5,approximately 10%[10] precious metals sleeve. Anything above approximately 15%[11] is a bet, not diversification.
Three allocation frameworks worth knowing
| Framework | Gold/PM weight | Logic | Realized drawdown protection |
|---|---|---|---|
| Permanent Portfolio (Browne, 1981) | approximately 25%[1] | Equal weight gold, stocks, long bonds, cash — one wins in each regime | Max drawdown of about −approximately 15%[2] in 2008 vs. −approximately 37%[3] for S&P 500 |
| All Weather (Bridgewater) | ~approximately 7.5%[4] gold + approximately 7.5%[5] commodities | Risk-parity across growth/inflation quadrants | Roughly 8%[6] annualized 2007–2022, lower volatility than 60/40 |
| Academic mean-variance optimum | 5–approximately 10%[7] | Maximizes Sharpe given gold’s ~0.0 to 0.1 correlation with US equities | Adds ~30–50 bps of Sharpe vs. zero-gold 60/approximately 40 in[8] 1972–2020 backtests |
The World Gold Council’s 2024 strategic asset study confirms the 5,approximately 10% range using a multi-asset optimizer across US, UK, and EU investor baselines.
The regimes where precious metals actually earn their keep
- Negative real rates — when 10-year TIPS yields fall below zero, gold’s opportunity cost vanishes. Gold returned +approximately 25%[10] in 2020 as real yields hit −approximately 1.1%[11].
- Currency debasement — sustained M2 growth above approximately 8%[1] annually historically pushes gold up double-digits the following year.
- Geopolitical stress — gold rose approximately 17%[2] in the six months after Russia’s 2022 invasion of Ukraine while equities fell.
Outside these regimes, think 1980,2000 disinflation, gold lost approximately 70%[3] of purchasing power. Allocation only pays when the macro backdrop cooperates, which is exactly why you size it as insurance, not as a core return engine.
Common Scams, Beginner Mistakes, and Red Flags to Avoid
Quick answer: The five costliest traps in precious metals are numismatic upsells (40,approximately 100%[4] markups disguised as “rare coin” appreciation), unallocated pool accounts where no specific bars are titled to you, home-storage IRA pitches the IRS explicitly disallows, fabricated assay certificates on tungsten-cored fake bars.
And proof coin premiums that take a decade to recoup.
The Bait-and-Switch Pattern Regulators See Most
A customer calls about American Gold Eagles at approximately 4%[5] over spot. The salesperson “upgrades” them into pre-1933 Saint-Gaudens or graded modern proofs carrying 35,approximately 55%[6] premiums, citing “confiscation protection”, a myth.
The CFTC and 30 state attorneys general settled a approximately $185[7] million case against Metals.com / TMTE in 2020 built on exactly this script targeting retirees rolling over IRAs.
Home-Storage IRA and Pool Account Traps
The IRS requires IRA-held bullion sit with an approved non-bank trustee under IRC §408(m). “LLC checkbook” home-storage schemes have lost in Tax Court (see McNulty v.
Commissioner, 2021) and trigger full distribution tax plus penalties. Unallocated pool accounts are equally dangerous, you’re an unsecured creditor, as Bullion Direct customers learned losing roughly $30[8] million in the 2015 bankruptcy.
Dealer Vetting Checklist
- ICTA membership (Industry Council for Tangible Assets) — indicates regulatory engagement
- BBB rating A or higher with under 10 complaints over 3 years
- Published buyback spread in writing — refuse vague “market price” language
- Bid/ask within approximately 5% on Eagles, approximately 3% on bars — anything wider is a markup, not a coin
- Segregated storage option with serial numbers, not pooled
- No high-pressure “limited mintage” calls — legitimate dealers don’t cold-call
Frequently Asked Questions About Precious Metals Investing
What does “poor man’s silver” actually refer to?
It’s a nickname for pre-1965 US approximately 90%[10] silver coins, dimes, quarters, and half-dollars sold by face-value bags. A approximately $1,000[11] face bag contains roughly 715 troy ounces of silver. Premiums typically run 2,approximately 5%[1] over spot, lower than most rounds.
What are the eight precious metals?
Gold, silver, and the six platinum-group metals: platinum, palladium, rhodium, ruthenium, iridium, and osmium. Only the first four trade with retail liquidity. See the Wikipedia entry on precious metals for the full classification.
Do precious metals actually beat inflation?
Over long windows, yes, gold returned about 7.7%[2] annualized from 1971 to 2024 versus 4% US CPI. Over 10,15 year stretches (1980,1999, 2011,2018), gold lost real value. Inflation hedging works decade-to-decade, not year-to-year.
How much should I allocate?
Mainstream financial planners suggest 5,approximately 10%[3]. Harry Browne’s Permanent Portfolio uses approximately 25%[4]. Anything above approximately 20%[5] becomes a directional bet, not diversification.
Where do I check live prices and find reputable dealers?
For spot quotes, use Kitco or the LBMA price page. For dealer vetting, cross-check Better Business Bureau ratings, the CFTC fraud advisories, and ICTA membership.
Should You Invest in Precious Metals — A Decision Framework
Direct answer: Yes, if you need an inflation hedge, currency-debasement insurance, or a true diversifier, sized at 5,approximately 10%[6] of a long-term portfolio. No, if your goal is compounding growth, dividend income, or a horizon under three years.
Run this four-question filter before buying anything:
- Why do you want exposure? If the answer is “tail-risk hedge,” gold wins. If it’s “used play on industrial demand,” silver or platinum fit. “Fear of dollar collapse” alone isn’t a thesis — pair it with a real allocation rule.
- What’s your horizon? Gold’s worst real drawdown lasted 20 years (1980–2000, –approximately 85%[7] peak to trough adjusted for CPI per BLS data). If you can’t stomach two decades underwater, cap allocation at approximately 5%[8].
- Which account? Hold physical or PHYS in a Roth IRA to neutralize the approximately 28% collectibles rate. Taxable accounts favor mining equities (15–approximately 20%[10] LTCG) over bullion ETFs like GLD.
- What gets sold to fund it? Trim bonds, not equities — metals correlate –0.10 with Treasuries and +0.05 with the S&P 500 over rolling 10-year windows.
Next concrete step: open a brokerage sub-account, buy a approximately 3%[11] starter position in IAU or PHYS, and set a calendar reminder to rebalance annually. Add silver or platinum only after you’ve held the core gold sleeve through one full drawdown cycle.
Precious metals reward patience, and punish anyone who treats them like a trade.
References
- [1]en.wikipedia.org/wiki/Precious_metal
- [2]usmint.gov/coins/precious-metal-coins/
- [3]ticker.app/commodities/precious-metals
- [4]sbcgold.com/investing-101/what-are-precious-metals/
- [5]usmint.gov
- [6]kitco.com/price/precious-metals
- [7]apmex.com
- [8]uspreciousmetals.com
- [9]youtube.com/watch
- [10]texmetals.com
- [11]moneymetals.com