Introduction
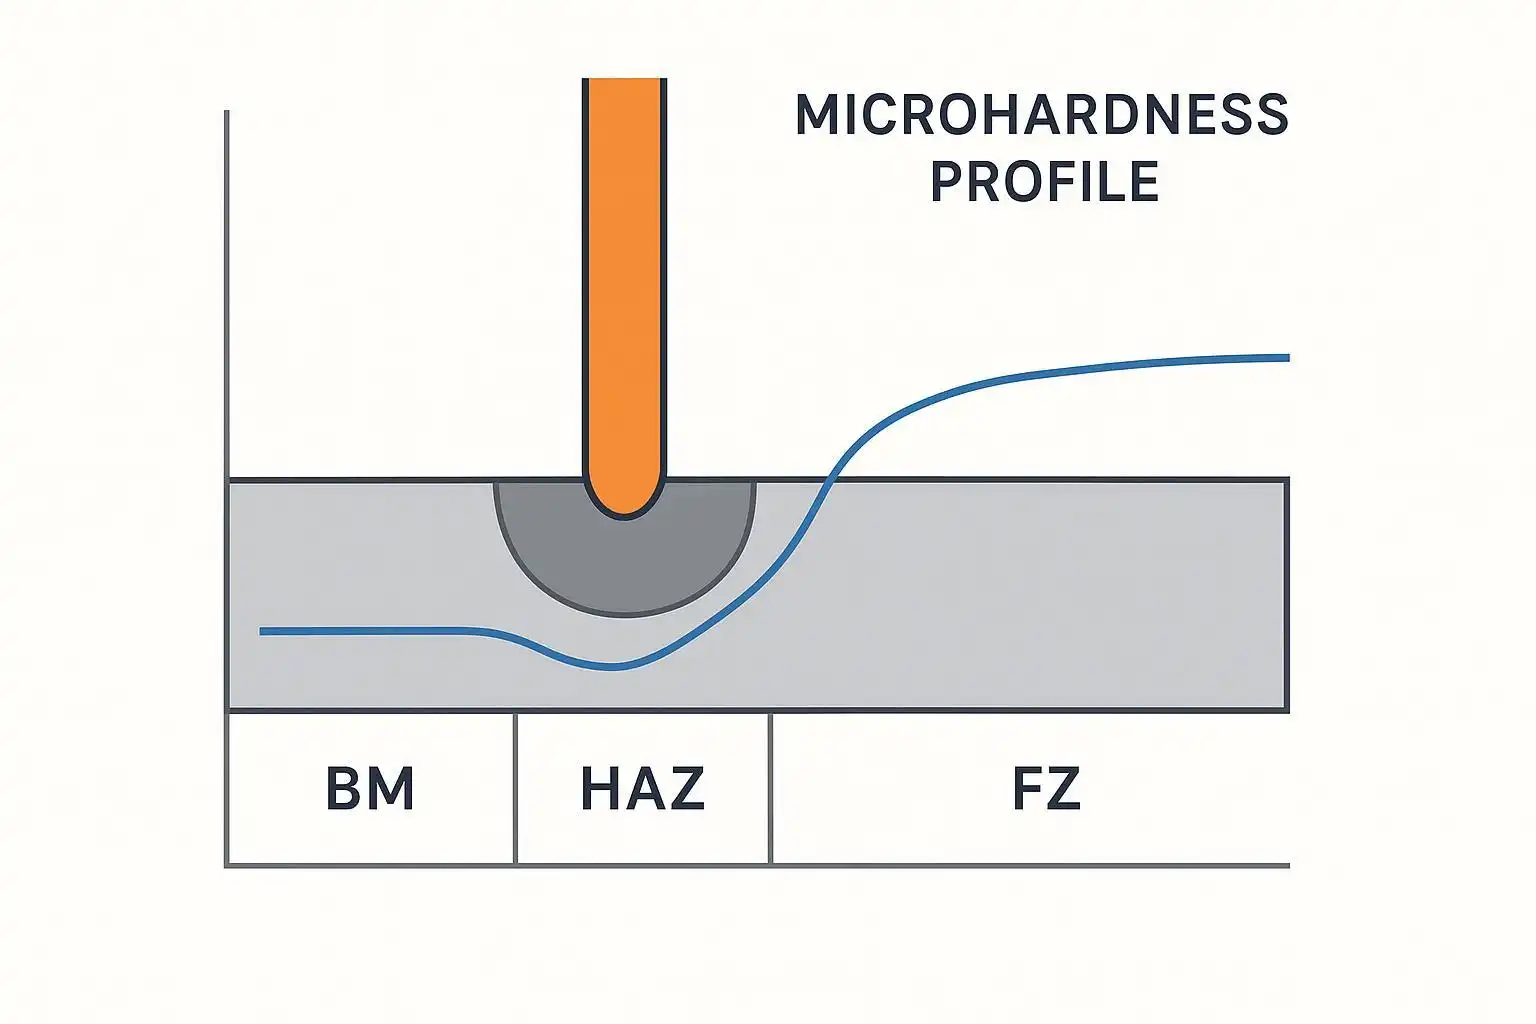
The laser weld microhardness gradient is the spatial change in hardness measured across the base metal (BM), heat-affected zone (HAZ), and fusion zone (FZ). Because laser welding imposes steep thermal cycles, the gradient encodes which subzones hardened, softened, or remained unchanged. In quality assurance (QA), that profile is a compact fingerprint of the weld’s thermal history and microstructure.
Why do fluctuations matter? Steep hardness jumps localize strain during cyclic loading, while deep soft bands lower the local yield strength. Both conditions shorten fatigue life and can elevate the risk of brittle initiation. In precipitation-hardened systems, nonuniform hardness can also correlate with corrosion susceptibility due to microstructural heterogeneity. For day-to-day engineering, the laser weld microhardness gradient works as a stability KPI: the narrower the HAZ and the smaller the peak-to-valley amplitude, the more repeatable and reliable the joint tends to be—assuming geometry and defects are controlled.
Key takeaways
- The laser weld microhardness gradient turns complex thermal history into a readable profile; steep peaks or deep dips are reliability red flags.
- For carbon/low-alloy steels, FZ often hardens while a tempered subcritical HAZ can dip; fatigue initiation prefers the softest band or the steepest gradient.
- For Al 6xxx/7xxx, a narrow softened HAZ typically governs joint efficiency; aim to narrow this band by reducing linear energy and improving shielding.
- Treat gradient amplitude (e.g., FZ peak – HAZ minimum) as a practical stability KPI, not a universal acceptance criterion—always reference the project code.
- Test to ISO/EN: use Vickers per ISO 6507-1 (method overview), layouts per EN ISO 9015-2:2016 (microhardness on welded joints), and ISO 22826 scope for narrow laser/e-beam seams; document loads, spacing, locations, and uncertainty.
Decoding the gradient
Profiles across BM–HAZ–FZ
Across steels, a common pattern is BM at baseline hardness, a complex HAZ that may include a grain-coarsened region and a tempered sub-zone, and an FZ peak driven by martensite/bainite formation under high cooling rates. In aluminum 6xxx/7xxx, the signature is different: a distinct softened HAZ caused by precipitate dissolution/coarsening, with the FZ typically sitting between the HAZ minimum and BM.
Authoritative experimental studies illustrate these patterns and their origins in thermal history and phase transformations—see the hot-stamped steel work by Šebestová et al. (2021) and the aluminum overview by Song et al. (2023).
Fluctuation cues and defects
Small oscillations in hardness along a traverse can reflect alternating microstructures (e.g., martensite/bainite patches), local reheating from overlapping passes, or micro-defects that alter local cooling. Abrupt drops near the fusion boundary may indicate lack of fusion, porosity clusters, or inclusions affecting the imprint response. In aluminum, an unusually wide soft band often points to excessive linear energy or unnecessary preheat.
Hardness vs performance links
- Fatigue: Regions with the lowest hardness—or where hardness changes fastest—tend to concentrate cyclic plasticity. Narrower HAZ and moderated amplitude generally align with better high-cycle fatigue performance in both steels and aluminum. For UHSS laser welds, see the tensile/fatigue evidence summarized in the University of Oulu thesis “Tensile and fatigue properties of laser-welded UHSS lap joints” (2020).
- Corrosion and SCC context: Microstructural nonuniformity can create local galvanic differences; parameter sets that avoid extreme hard martensite and reduce heterogeneity are associated with better outcomes in galvanized steels, as discussed by Górka et al. (2023).
Ferrous alloys
Carbon and low-alloy steels
Laser cooling rates often drive an FZ peak via martensite/bainite, while subcritical reheating may temper parts of the HAZ, creating a local minimum. Typical contextual ranges include BM roughly 150–220 HV, FZ in UHSS commonly 300–500+ HV, and a subcritical HAZ minimum that can sit at or below BM depending on the thermal cycle. The risk lens for fatigue is the peak-to-valley span and where the minimum lands relative to BM.
Process implications for reliability include managing linear energy to avoid overly hard FZ/CGHAZ, using beam oscillation (wobble) to break columnar growth and homogenize the pool, and verifying shielding and fit-up to prevent defects that confound interpretation. Hybrid laser-arc variants can moderate extremes by reducing cooling rates and improving compositional uniformity. For microstructure and hardness trends in DP/UHSS steels, see Mansur et al. (2021).
Austenitic stainless steels
Austenitic grades typically don’t show dramatic hardening from martensite in the FZ, but sensitization and delta-ferrite balance can nudge hardness locally. The gradient is often smoother than in martensitic-prone steels; still, abrupt oscillations may hint at porosity or lack of fusion. Heat input and shielding quality remain levers to stabilize the profile. Broader heat-input trends in laser-welded stainless are synthesized by Kang et al. (2023).
Duplex stainless steels
In duplex systems, the gamma/alpha balance and secondary phases (e.g., sigma) govern local hardness peaks or valleys. Excessive heat input risks deleterious phases and profile irregularity; the control strategy centers on keeping phase balance within spec and documenting any thermal excursions seen in hardness trends.
Light and high-temperature alloys
Aluminum alloys
In 6xxx/7xxx, the hallmark is a softened HAZ driven by precipitate dissolution/coarsening (βʺ for 6xxx, η′ for 7xxx). The HAZ minimum often sits 20–30% below BM; FZ values vary with dilution and porosity but usually land between HAZ and BM. From a fatigue perspective, the softened band is typically the life limiter. Practical control focuses on minimizing linear energy (higher travel speed, tight focus), maintaining clean, consistent shielding (Ar/He), and using compatible filler to mitigate hot cracking and refine FZ dendrites. Preheat is generally minimized because it can widen the softened zone. See Song et al. (2023) review for mechanisms and trends.
Titanium alloys
Titanium welds can show hardness increases via acicular products or α′ martensite depending on cooling rate. While not the main focus here, a steep gradient can still signal uneven thermal exposure or shielding issues (e.g., alpha case). Keep gas purity high and verify post-weld color/etch cues alongside hardness trends.
Nickel-based superalloys
Solidification structure and precipitation state control the gradient. Excessive heat input can coarsen precipitates and widen soft regions; very fast cooling may create local hardness steps. Because property targets are application-specific, interpret gradients with supporting micrographs and, if needed, EBSD to confirm phase and grain size distributions.
Process levers and control
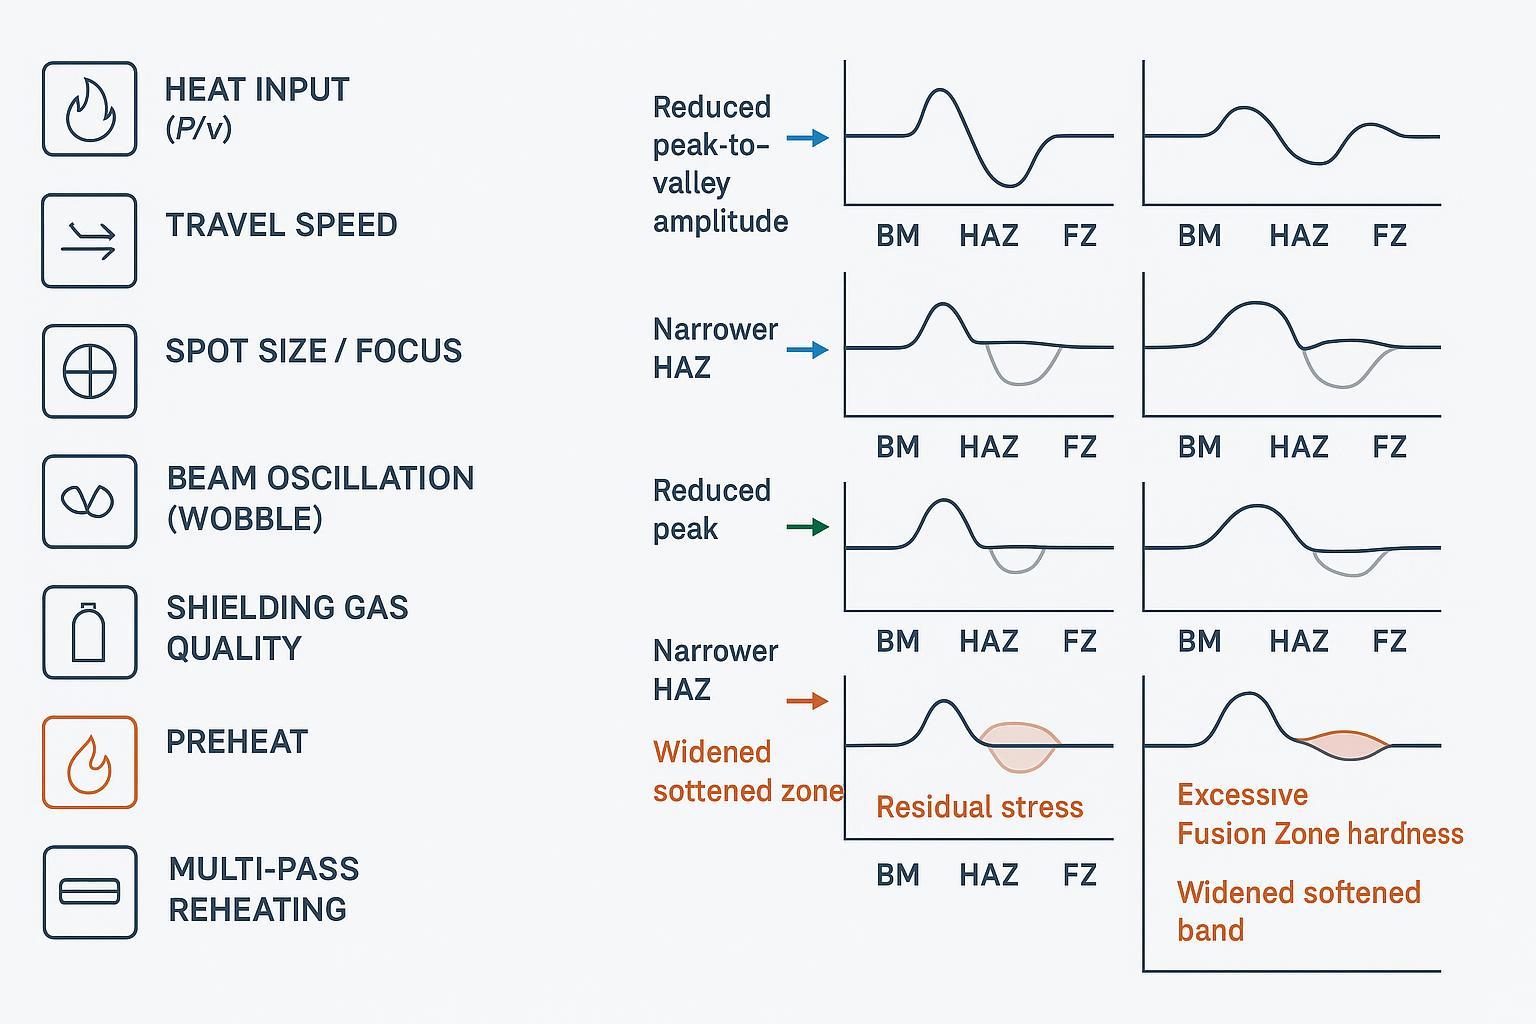
Heat input, oscillation, shielding
Linear energy (power/travel speed) sets the width and severity of the gradient. Higher speed (lower energy) tends to narrow the HAZ, refine the FZ, and, in aluminum, reduce HAZ softening. Beam oscillation redistributes heat and breaks columnar growth, often yielding a more uniform profile—see wobble effects discussed by Nicola et al. (2023). Stable shielding—flow rate, nozzle standoff, and gas choice—reduces oxidation/porosity, improving run-to-run repeatability of hardness readings.
Preheat, multi-pass, filler
For steels, targeted preheat can temper extremes and reduce cold-cracking risk, but may broaden the HAZ if overdone. Multi-pass or overlapping tracks can create tempered sub-zones—log pass sequence and confirm locations in the hardness map. In aluminum, avoid routine preheat unless fit-up demands; it typically enlarges the softened band. Filler selection influences hot-cracking susceptibility and FZ dendrite refinement; match chemistry and avoid galvanic pitfalls in dissimilar joints.
Stabilize gradient amplitude
Use gradient amplitude (e.g., FZ peak – HAZ minimum or BM – HAZ dip) as a tuning compass. Reduce linear energy to narrow the HAZ; apply small-amplitude wobble to homogenize; verify shielding and cleanliness to remove confounding variables. Track improvements with consistent Vickers loads and spacing, overlaid on etched cross-sections to confirm indent placement versus the fusion line.
Practical micro-example: On a modern fiber-laser platform such as Oceanplayer, an engineer increases travel speed from 30 to 40 mm/s on a DP600 lap weld and enables a 0.5 mm amplitude, 300 Hz wobble. The subsequent mid-thickness traverse (HV0.5, 0.5 mm pitch) shows a narrowed HAZ and a reduced peak-to-valley span, while maintaining penetration verified by macro-etch. This approach is repeatable across materials with parameter-specific adjustments and should always be confirmed against the applicable ISO procedure qualification or production standard.
Testing and standards
Vickers method, loads, spacing
Follow Vickers per ISO 6507-1 (method overview): select appropriate test force for the zone size, apply a 10–15 s dwell, and maintain spacing to avoid interaction between indents. For microhardness on welded joints, use EN ISO 9015-2:2016 to define traverse rows, positions, and reporting on transverse sections. For very narrow laser seams where standard traverses may overlap, consult the ISO ICS 25.160.40 index (scope area incl. ISO 22826), which covers hardness testing on narrow joints and permits low forces (including Knoop where justified) and constrained placements suitable for laser/e-beam welds. ISO-aligned practices are summarized by vendors such as Struers’ Vickers overview.
Mapping strategy and statistics
At minimum, run a mid-thickness transverse traverse across BM–HAZ–FZ–HAZ–BM with 0.5–1.0 mm spacing where feasible. Add a near-surface traverse for thin gauges to capture cap/root effects. For critical parts or where scatter is high, build a 2D grid (≥50–100 points) to visualize the gradient and compute robust statistics. Report zone means, minima/maxima, standard deviation, and clearly identify the smallest HAZ value and the FZ peak. Always log machine ID, calibration status, load, dwell, spacing, exact positions, and include etched images with the fusion line overlayed.
Codes and acceptance notes
- ISO 15614-1 (steels) overview at TWI: Procedure qualification typically includes hardness testing (often HV10) with maximum values and sampling plans tied to material groups. Consult the project specification for the applicable table and limits; many ferritic steel applications cap hardness around the low-300s HV10, with sour-service contexts applying stricter caps by reference to related documents such as NACE guidance summarized by TWI’s NACE hardness note.
- ISO 15614-2 page (aluminum): Emphasizes tensile and bend; hardness profiles are frequently recorded for QA/process tuning, but strict acceptance thresholds are application-specific rather than universal.
Two-minute setup table (ISO-consistent practice)
| Item | Recommendation |
|---|---|
| Method & scope | Vickers per ISO 6507-1; layouts per EN ISO 9015-2; use ISO 22826 for very narrow laser seams |
| Loads & dwell | HV0.2–HV1 for micro-zones; HV5–HV10 for macro traverses; 10–15 s dwell |
| Spacing & pitch | ≥3× diagonal between indents; 0.5–1.0 mm pitch across BM–HAZ–FZ where feasible |
| Traverses | Mid-thickness minimum; add near-surface; 2D grid (≥50–100 points) for critical parts |
| Reporting | Zone means, minima/maxima, SD; machine ID, calibration, load, dwell, spacing; etched cross-section with fusion line |
For procedural specifics and definitions, consult the primary standards, including EN ISO 9015-2:2016 and the ISO ICS 25.160.40 index (scope incl. ISO 22826).
Conclusion
Reading the laser weld microhardness gradient is a fast, powerful way to assess weld stability and reliability. Focus on the HAZ minimum and the peak-to-valley amplitude; if they look aggressive, reduce linear energy, consider modest beam oscillation, and verify shielding and cleanliness. On the testing side, align with ISO 6507-1, EN ISO 9015-2:2016, and the ISO ICS 25.160.40 index for ISO 22826 for narrow seams; use consistent loads and spacing, and overlay indents on etched images for context. When hardness fluctuations remain unexplained—or correlate with brittle behavior, anomalous soft bands, or inconsistent properties—escalate to EBSD for grain/phase mapping and SEM/EDS for porosity or segregation confirmation; open-access exemplars include Ramaphoko et al. (2022) on laser lap joints. Keep a disciplined log of parameters, maps, and micrographs so that lessons transfer from qualification to production without surprises.