If you work in a foundry, heat‑treat shop, or general fabrication, you rely on melting behavior to choose furnace setpoints, avoid incipient melting, and reduce casting defects. Yet many “melting point” pages blur the line between pure elements and alloys, which actually melt over a range.
This guide puts the basics, the data, and the practical rules in one place. You’ll get a clean, cited metal melting point chart for common pure metals, a compact table of representative alloy solidus–liquidus ranges, and step‑by‑step advice for using those numbers in smelting/casting and heat treatment.
Key takeaways
- Pure metals have a single melting point; most alloys do not. Alloys melt over a solidus–to–liquidus range. That range affects casting fluidity, feeding, and defect risk.
- For casting, heat above the alloy’s liquidus for full melt and adequate fluidity. Excess superheat increases oxidation, gas pickup, and coarse microstructures—use only what you need.
- For solution heat treatment, stay below solidus to prevent incipient melting, especially near eutectic-onset temperatures. Tight furnace control is essential.
- The metal melting point chart should show both °C and °F and name a primary source. Expect small variations across references due to purity, measurement methods, and rounding.
- When production decisions are on the line, consult the specific alloy datasheet or standard; chart values are orientation, not a substitute for specifications.
Melting point, solidus, liquidus, and eutectic explained
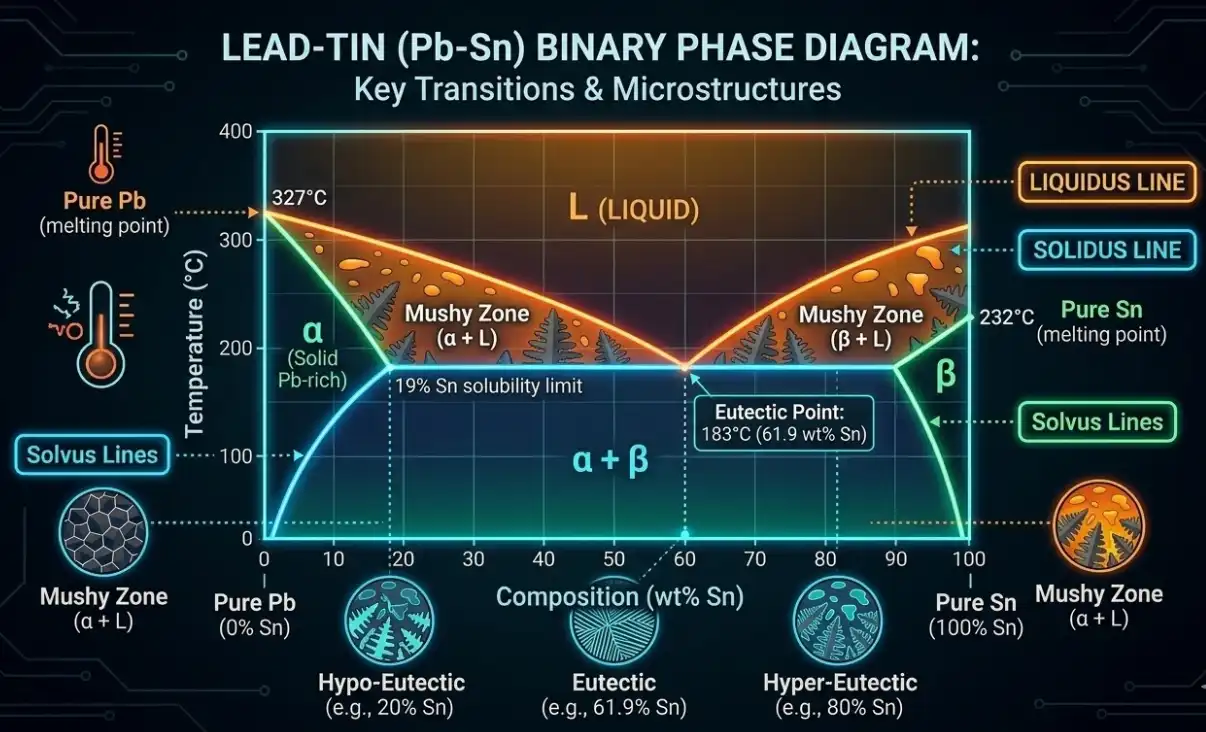
When we say a metal “melts at” a temperature, we’re usually talking about a pure element. A pure crystalline element transitions from solid to liquid at a sharply defined temperature under standard pressure. Alloys are different: they enter a two‑phase region where solid and liquid coexist between the solidus (first liquid appears) and the liquidus (last solid dissolves).
- Melting point: For pure metals at 1 atm, a single temperature at which solid and liquid are in equilibrium.
- Solidus: On heating, the temperature where melting just begins; below this, the metal is fully solid.
- Liquidus: On heating, the temperature where melting completes; above this, the metal is fully liquid.
- Eutectic: A special composition with the lowest melting temperature for that system; solidus and liquidus meet, and the alloy transitions between liquid and two solid phases at one temperature.
A short primer with clear diagrams is available in the university text from LibreTexts under phase equilibria, which illustrates how to read two‑phase fields and the difference between solidus and liquidus in beginner‑friendly terms; see the explanatory overview in Phase Equilibria and Phase Diagrams hosted by LibreTexts. You can also find a concise definition set and schematic diagrams in an overview excerpt related to the ASM Alloy Phase Diagrams collection.
- See introductory definitions and diagrams in the Phase Equilibria and Phase Diagrams primer from LibreTexts (university resource, 2025 access): https://chem.libretexts.org/Bookshelves/Inorganic_Chemistry/Introduction_to_Solid_State_Chemistry/01:_Lectures/1.10:_Phase_Equilibria_and_Phase_Diagrams
- See an overview excerpt with alloy phase diagram schematics referencing the ASM Handbook series (archival PDF, 2024 access): https://users.encs.concordia.ca/~tmg/images/5/59/ASM_handbook_Vol3_alloys_phase_diagram.pdf
Think of it this way: the solidus is the first ice crystals forming in a slushy, and the liquidus is the last ice melting away. The wider that “slushy” interval, the more attention you need to pay to feeding and solidification in castings—and the more carefully you must avoid the onset of melting during solution heat treatment.
Metal melting point chart
The table below lists widely used pure metals with their melting points in °C and °F. Values are anchored to a consolidated NIST compilation of phase transition temperatures for the solid elements at standard pressure. Fahrenheit values are converted and rounded to the nearest whole number for shop‑floor readability.
According to the NIST publication Phase Transition Temperatures of the Solid Elements (2011; updated access 2025), normal melting points at 101.325 kPa are as follows: https://tsapps.nist.gov/publication/get_pdf.cfm?pub_id=958924
| Metal (pure) | Melting point °C | Melting point °F | Source |
|---|---|---|---|
| Aluminum | 660.3 | 1221 | NIST phase transition table (link above) |
| Magnesium | 650.0 | 1202 | NIST phase transition table (link above) |
| Zinc | 419.5 | 787 | NIST phase transition table (link above) |
| Tin | 231.9 | 449 | NIST phase transition table (link above) |
| Lead | 327.5 | 621 | NIST phase transition table (link above) |
| Copper | 1084.6 | 1985 | NIST phase transition table (link above) |
| Nickel | 1455 | 2651 | NIST phase transition table (link above) |
| Iron | 1538 | 2800 | NIST data set; see Chemistry WebBook hub: https://webbook.nist.gov |
| Titanium | 1668 | 3034 | NIST phase transition table (link above) |
| Tungsten | 3422 | 6192 | NIST phase transition table (link above) |
Methodology notes:
- Expect small discrepancies across credible references. Purity, thermometry scale updates (e.g., ITS‑90), and rounding practices shift values by a degree or two. This chart uses NIST’s consolidated dataset as the reference of record and rounds °F to whole numbers.
- For alloys, don’t use single‑point values. Use the solidus–liquidus range from datasheets and standards.
Alloy melting ranges for process selection
Unlike pure elements, alloys occupy a melting interval. That interval determines how much superheat you need for a clean pour and how close you can safely set a solution treatment without risking incipient melting. Here are representative ranges for widely used families. Use them for orientation, then confirm against your specific specification or supplier datasheet.
| Alloy system | Typical solidus °C | Typical liquidus °C | Notes and source |
|---|---|---|---|
| A356 cast aluminum (Al–Si–Mg) | ~555–557 | ~610–615 | Casting alloy with notable freezing range; see ASM chapter on 356/A356 and MatWeb ASM‑derived datasheet for 356.0‑F: https://www.matweb.com/search/datasheet.aspx?matguid=4625707f449a43b59a6dbdbf9617526b&n=1 |
| 6061 wrought aluminum (Al–Mg–Si) | ~582 | ~651–652 | Widely cited for solution HT close to but below solidus; see ASM‑derived data via MatWeb: https://www.matweb.com/search/datasheet.aspx?MatGUID=b8d536e0b9b54bd7b69e4124d8f1d20a |
| 7075 wrought aluminum (Al–Zn–Mg–Cu) | ~477 | ~635 | High‑strength Al‑Zn‑Mg‑Cu with low solidus; see ASM/MatWeb entries for 7075 tempers: https://asm.matweb.com/search/specificmaterial.asp?bassnum=ma7075t6 |
| Inconel 718 (UNS N07718) | ~1260 | ~1335–1336 | Nickel‑base superalloy; see manufacturer technical bulletin and ASM‑derived data via MatWeb: https://www.specialmetals.com/documents/technical-bulletins/inconel/inconel-alloy-718.pdf |
Why these ranges matter
- Casting: A wider freezing range (liquidus minus solidus) tends to increase interdendritic feeding challenges and can raise hot‑tear and microporosity risk if gating/risering isn’t optimized. A metallurgical study in the TMS Superalloys proceedings associated longer “freezing ranges” with increased hot tear severity and porosity for cast superalloys; see Superalloys 2008 for an example analysis: https://www.tms.org/Superalloys/10.7449/2008/Superalloys_2008_357_366.pdf
- Heat treatment: Solution temperature must be below solidus to avoid eutectic melting along grain boundaries, which can be hard to detect visually yet severely degrades properties. An ASM excerpt hosted by NIST on heat treating aluminum warns against this risk and emphasizes careful control near solution temperatures: https://materialsdata.nist.gov/bitstream/handle/11115/192/Heat%20Treating%20of%20Aluminum%20Alloys.pdf?sequence=3&isAllowed=y
Using melting data for casting
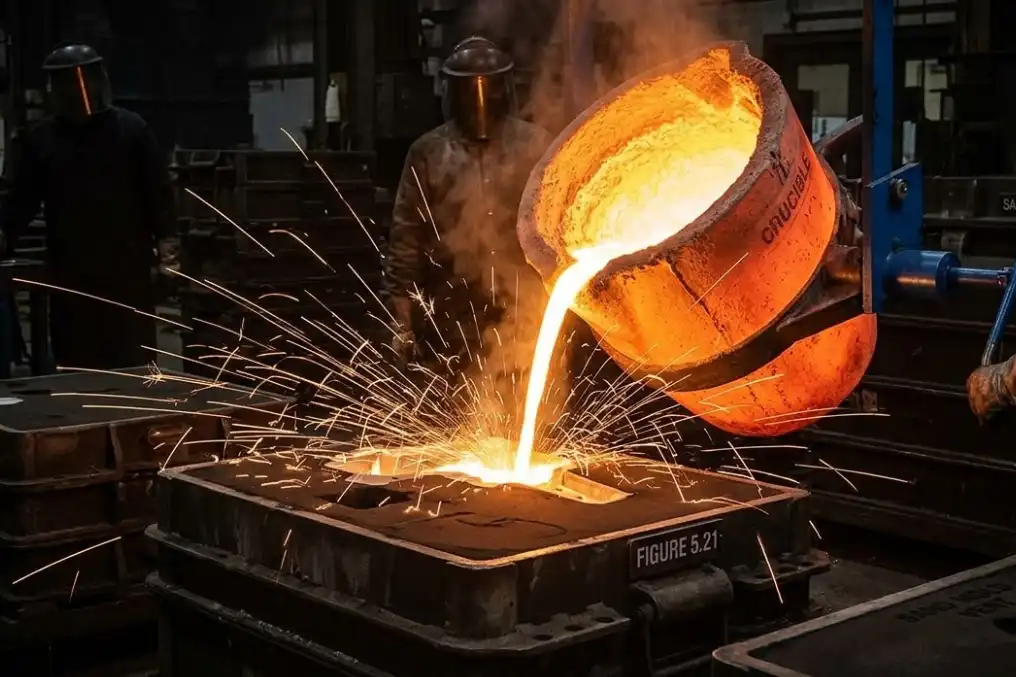
Set melt and pour temperatures with the liquidus as your north star. Above liquidus, the alloy is fully liquid; the question becomes how much superheat you need for sound flow and fill, without inviting side effects.
- Superheat for fluidity: Many shops target a modest superheat above liquidus to achieve consistent fill. Excessive superheat accelerates oxide film formation, hydrogen pickup (for aluminum), and coarsens grains. Keep it to what your process requires, then pour promptly to limit hold time.
- Freezing range and feeding: Alloys with a broad freezing range (e.g., many Al–Si and Cu‑base systems) are more prone to interdendritic feeding problems. Directional solidification, adequate risering, and clean thermal gradients matter more as the range widens.
- Process differences: High‑pressure die casting typically uses lower superheat than sand casting because short fill times and high injection velocities provide flow energy; permanent mold sits in between. Record your process window and defect trends, and tune empirically within spec.
Mini‑example
- A356 casting alloy has a liquidus nominally around 610–615 °C. A sand casting shop may find that pouring in the upper 680–720 °C band provides adequate fluidity for complex sections while minimizing oxide defects—provided degassing and fluxing are well controlled. Treat such numbers as practice‑based orientation; validate against your specification and trial data.
Practical cautions
- Charts orient; datasheets govern. For production, defer to alloy standards and OEM specifications for recommended melt/hold/pour windows.
- Hold time matters. Even with good superheat, long holds can degrade melt quality. Tie your temperature to time and metallurgical quality metrics (density index, hydrogen content, inclusion counts) rather than temperature alone.
Using melting data for solution heat treatment
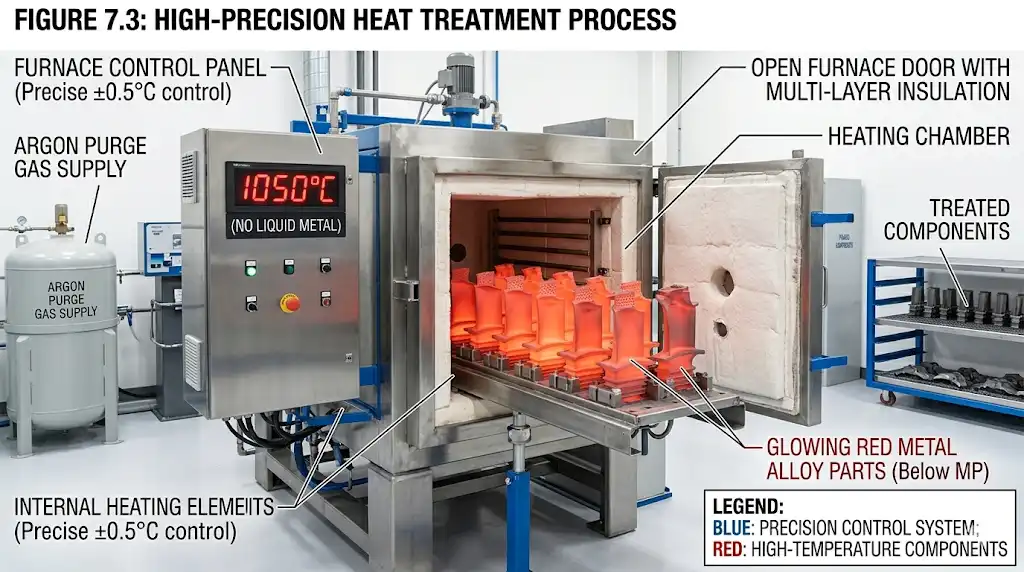
Solution treatment aims to dissolve alloying elements into solid solution without crossing into the two‑phase melt field. That means staying below solidus—and close enough to drive diffusion.
- Work near, not beyond, the edge: Many aluminum alloys are solutionized within a narrow window just below solidus. An ASM excerpt hosted by NIST on aluminum heat treating underscores the risk of incipient melting at eutectic films if you stray above the onset; tight control (±5 °C typical guidance in industry primers) is common practice for critical parts.
- Composition sensitivity: Alloys like 7075 have a relatively low solidus compared to more dilute Al–Mg–Si grades; apply conservative margins and calibrate furnaces before any high‑temperature campaign.
- Sequence discipline: If you change alloy lots or chemistries, re‑verify the appropriate target temperatures. Don’t assume last month’s settings are safe for today’s composition window.
Quick rules of thumb with caution
- Never exceed solidus during solution treatment. If you don’t have a published solidus, consult a reliable datasheet or standard before proceeding.
- Start with a conservative offset below solidus, qualify with hardness/conductivity and microstructure checks, then tighten toward the upper bound as capability allows.
- Remember that thermal lag and part mass alter actual part temperature. Use load thermocouples during qualification runs.
For foundational reading, see the NIST‑hosted ASM excerpt Heat Treating of Aluminum Alloys, which explains how solutionizing is set with respect to solidus and solvus and why overstepping can permanently damage properties: https://materialsdata.nist.gov/bitstream/handle/11115/192/Heat%20Treating%20of%20Aluminum%20Alloys.pdf?sequence=3&isAllowed=y
Quick decision checklist for shop use
Use this skimmable checklist when you’re setting up a melt or a solution cycle.
- Identify whether you have a pure metal or an alloy. If alloy, find both solidus and liquidus from a datasheet or standard.
- For casting, set furnace above liquidus with only the superheat you need for fluidity and die/mold fill. Tune with trial pours and defect data.
- For heat treatment, set solution temperature below solidus and confirm with load thermocouples and post‑process property checks.
- Watch the freezing range. A wide range signals higher feeding and hot‑tear risk—optimize gating/risering and cooling paths.
- Document your validated window. Record alloy chemistry, furnace calibration status, and results so future runs start from known‑good conditions.
FAQs
Why do different sites list slightly different melting points for the same metal?
- Small differences come from purity level, calibration scale, and rounding rules. Authoritative compilations such as the NIST phase transition table are preferred as a reference point, but a degree or two of spread is normal.
Why does an alloy list a range instead of one number?
- Because alloys enter a two‑phase region during melting. Below solidus the alloy is fully solid; above liquidus it’s fully liquid. In between, both phases coexist. The width of that interval depends on composition and the phase diagram of the system.
How do I convert between °C and °F quickly?
- Use °F = (°C × 9/5) + 32 and °C = (°F − 32) × 5/9. For quick head math, 100 °C is 212 °F, 650 °C is about 1200 °F, and 1500 °C is about 2730 °F.
Is a higher melting point always better for high‑temperature service?
- Not necessarily. Creep strength, oxidation resistance, phase stability, and coating systems all matter. Melting point is one indicator among many for service selection.
Sources and further reading
- NIST consolidated element melting points with values at standard pressure in Phase Transition Temperatures of the Solid Elements (2011; 2025 access): https://tsapps.nist.gov/publication/get_pdf.cfm?pub_id=958924
- NIST Chemistry WebBook as a hub for elemental data and thermophysical properties: https://webbook.nist.gov
- LibreTexts university primer on Phase Equilibria and Phase Diagrams with accessible solidus/liquidus diagrams: https://chem.libretexts.org/Bookshelves/Inorganic_Chemistry/Introduction_to_Solid_State_Chemistry/01:_Lectures/1.10:_Phase_Equilibria_and_Phase_Diagrams
- Overview excerpt referencing ASM Alloy Phase Diagrams with schematic examples: https://users.encs.concordia.ca/~tmg/images/5/59/ASM_handbook_Vol3_alloys_phase_diagram.pdf
- MatWeb ASM‑derived datasheets for representative alloys: 356.0‑F (A356) datasheet: https://www.matweb.com/search/datasheet.aspx?matguid=4625707f449a43b59a6dbdbf9617526b&n=1 and 6061 datasheet: https://www.matweb.com/search/datasheet.aspx?MatGUID=b8d536e0b9b54bd7b69e4124d8f1d20a and 7075‑T6 entry: https://asm.matweb.com/search/specificmaterial.asp?bassnum=ma7075t6
- Manufacturer technical bulletin for Inconel 718 with melting range context: https://www.specialmetals.com/documents/technical-bulletins/inconel/inconel-alloy-718.pdf
- NIST‑hosted ASM excerpt on Heat Treating of Aluminum Alloys covering solutionizing relative to solidus and risks of eutectic melting: https://materialsdata.nist.gov/bitstream/handle/11115/192/Heat%20Treating%20of%20Aluminum%20Alloys.pdf?sequence=3&isAllowed=y
- Superalloys conference proceedings paper linking freezing range to hot tearing and porosity trends (FSX‑414 case): https://www.tms.org/Superalloys/10.7449/2008/Superalloys_2008_357_366.pdf
A final word:
Treat any metal melting point chart as a starting point. For critical operations, always confirm solidus–liquidus with the exact alloy specification, calibrate your furnace, and validate results on real parts before locking in production windows.