Introduction
Plant managers, operations leaders, and manufacturing engineers face a familiar bind: raising output and quality without ballooning total cost. Decisions are rarely made by one person; they involve engineering, production, maintenance, QA, and finance. This guide is for teams comparing fiber laser welding to MIG/TIG on thin-to-medium gauge assemblies—especially aluminum and stainless—and trying to prove or disprove a case for investment.
Fiber laser welding changes three things versus MIG/TIG. First, the energy is concentrated into a small spot, which enables high travel speeds and a narrow heat-affected zone. Second, it pairs naturally with automation and inline monitoring, which improves traceability and can raise first-pass yield. Third, many thin-gauge joints can be welded autogenously, reducing filler and post-processing. None of these are automatic wins; they depend on joint design, fixturing, and process control. This article lays out where the process fits, what advantages are realistic, and how to calculate payback.
What ROI factors and steps we cover
- Fit boundaries by material, thickness, and joint design
- Performance levers that influence throughput and quality
- A total cost of ownership view and a transparent ROI scaffold
- An implementation roadmap with safety and QA checkpoints
- A vendor evaluation checklist, plus how to engage the right support model
Key takeaways
- Fiber laser welding ROI hinges on cycle-time reduction, higher first-pass yield, and lower finishing and consumables. Treat energy as a smaller but real contributor.
- Best fit is thin-to-medium gauges with tight fixturing and controlled gaps. MIG/TIG may remain preferable on thick sections or when filler is structurally required.
- Inline monitoring and standards-compliant cells support repeatability and auditability—key for sustained ROI.
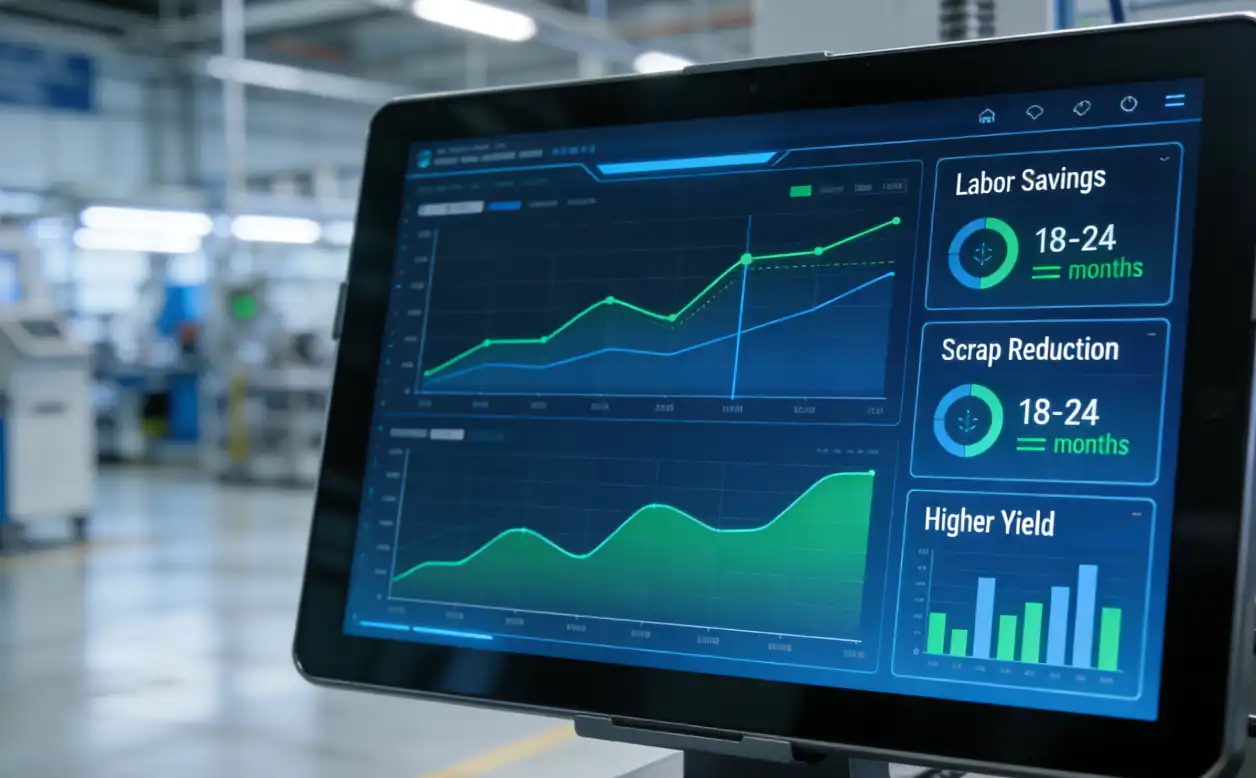
- Set expectations with a conservative base case targeting 18–24 months payback, then validate with trials and a pilot cell.
Fiber Laser Welding Fundamentals and Fit
Process basics and modes
Fiber lasers operate near 1,070 nm and can weld in conduction or keyhole mode depending on power density and travel speed. Common techniques include continuous-wave welding, pulsed welding, and oscillatory or “wobble” scanning. Remote welding with a scanner head enables rapid seam repositioning in robotic cells. Inline weld-depth measurement and seam tracking are increasingly standard; systems that measure keyhole depth through the main optics help reduce destructive testing and enable trend analysis, as described by IPG Photonics in its overview of inline coherent imaging for welds in the page on real-time weld measurement: direct weld-depth monitoring through the optics.
Materials and thickness window
The sweet spot is thin-to-medium-gauge metals—roughly 1–4 mm—with good joint fit-up and stable fixturing. Stainless steel is widely adopted for autogenous laser welding. Aluminum is workable and common in transportation, but its high reflectivity and susceptibility to porosity demand careful parameter control and shielding gas management. For thicker sections or where significant gap bridging or filler reinforcement is required, MIG or TIG may be more appropriate, a point echoed in industry comparisons that position laser as competitive in sheet and diminishing in advantage as thickness increases, as summarized in SMACNA’s overview of MIG, TIG, and laser suitability.
Independent, third‑party references to frame fit and performance
- For fit by material, thickness, and joint type, see TWI’s laser welding overview of thin‑sheet fit and joint types, which outlines where fibre lasers excel on lap and butt joints and the tighter gap tolerances versus arc processes.
- For performance baselines on speed and HAZ relative to TIG on thin stainless, a 2019 Journal of Materials Processing Technology comparative study on laser vs. TIG speed and HAZ reports order‑of‑magnitude travel‑speed advantages with a narrower HAZ, reinforcing the directional claims to be validated in your trials.
Fit-up, joints, and limitations
Laser welding prefers minimal gaps. Butt and lap joints are common on sheet assemblies. Tight fixturing to control joint geometry and part cleanliness are prerequisites. For aluminum, mitigate porosity with clean surfaces, appropriate wobble patterns, and stable shielding gas delivery. Inline monitoring adds guardrails but does not replace procedural controls.
Performance and Quality Advantages
Speed and throughput gains
Directional evidence from OEM FAQs indicates that laser welding is often much faster than TIG and can surpass MIG on thin gauges. For example, IPG Photonics notes that laser welding can be “up to 4X faster” than TIG in many applications, though exact speeds depend on material and thickness; treat this as directional guidance to be validated in trials as seen in IPG’s LightWELD FAQ. In automated cells, rapid repositioning via scanner heads and robots cuts non-weld time, which compounds throughput gains.
Low HAZ and distortion
Fiber laser’s concentrated energy input creates a narrow heat-affected zone relative to arc methods. A smaller HAZ reduces distortion, which in turn lowers post-weld straightening, grinding, and cosmetic finishing. Specific HAZ widths vary by alloy and parameters; avoid assuming fixed numbers without trials.
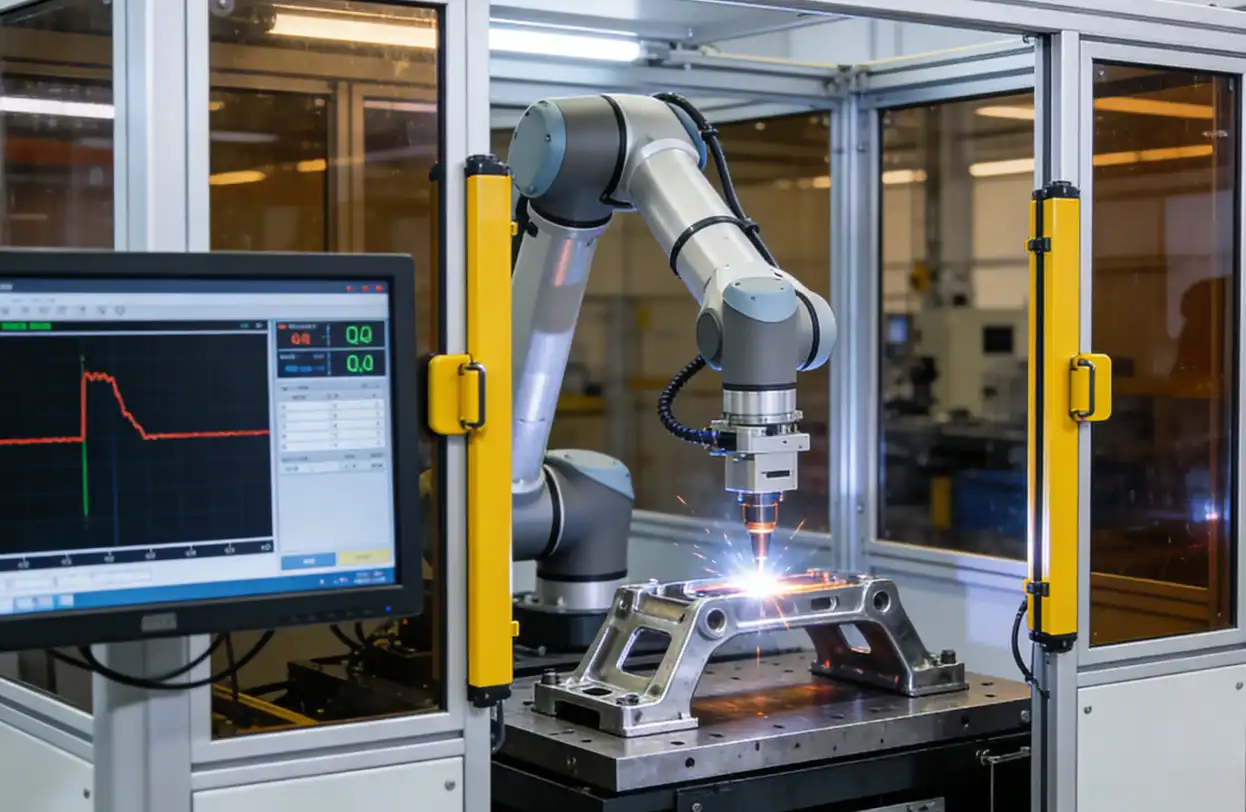
Automation and first-pass yield
Automation is where fiber lasers shine. With coaxial monitoring and data logging, teams can track weld penetration and stability in real time. IPG’s documentation on inline measurement explains how direct keyhole depth measurement provides faster validation and trend detection—capabilities that support higher first-pass yield and less destructive testing, summarized in IPG’s weld-depth monitoring overview.
ROI and Total Cost of Ownership
CAPEX, OPEX, and energy
Expect higher CAPEX for a fiber laser welding cell than for standalone arc stations. A turnkey cell bundles the laser source, scanner or welding head, robot or motion system, enclosure and interlocks, fume extraction, chiller, and fixturing. OPEX typically includes shielding gas, optics protection and cleaning, occasional replacement of protective windows, preventive maintenance, and chiller power. Vendors and trade sources consistently note fiber lasers’ electrical efficiency relative to legacy laser types; translating that advantage to cost-per-part requires application-specific power and duty cycle data. For macro efficiency positioning and automation context, see IPG Photonics’ 2024 investor presentation on productivity and labor trends.
Payback drivers and examples
Primary drivers of fiber laser welding ROI include:
- Cycle-time reduction from higher travel speeds and faster repositioning
- Higher first-pass yield through process stability and inline monitoring
- Lower post-processing and rework due to reduced distortion and spatter
- Reduced consumables when welding autogenously, versus wire and contact tips in MIG
- Energy and labor optimization through automation and planned utilization
A transparent ROI scaffold you can adapt
- Inputs
- Annual production volume per part number
- Weld length per part and average weld time per part
- Baseline cycle time and scrap or rework rates
- Expected laser cycle time and FPY
- Labor rate, shifts per year, utilization, and operators per cell
- Consumables and finishing costs per part before and after
- Energy cost per kWh, average process power, and total weld hours per year
- CAPEX for the cell and finance or depreciation assumptions
- Calculations
- Labor hours saved = (Baseline time − Laser time) × volume ÷ 3600
- Labor savings = labor hours saved × labor rate
- Scrap and rework savings = volume × (baseline scrap − laser scrap) × cost per failed part
- Finishing savings = volume × (baseline finishing − laser finishing)
- Energy delta = baseline energy − laser energy
- Net annual savings = labor + scrap/rework + finishing + energy − incremental maintenance
- Payback months = CAPEX ÷ (Net annual savings ÷ 12)
Aim your base case at 18–24 months. Then run a sensitivity analysis on utilization, FPY improvement, and cycle time to see the range of outcomes. That range is often what convinces finance to support a pilot.
Mini-case (modeled, anonymized): A medium-volume automotive bracket (aluminum lap joint, 2.5 mm) — annual volume 200,000 parts. Baseline: TIG at 12 s/part, FPY 95%, finishing $0.50/part. Laser cell: 4 s/part, FPY 99%, finishing $0.10/part. With a $30/hr labor rate, labor savings ≈ 444 hours/year (~$13,300); scrap/rework savings ≈ 8,000 fewer failed parts (~$160,000);
finishing savings ≈ $80,000. Net annual savings ≈ $253,000. With a $400,000 turnkey CAPEX, modeled payback ≈ 18–20 months. Assumptions: modeled numbers for illustration; validate with pilot trials and your actual costs.
2024–2026 trends impacting ROI
- Persistent skilled welder shortages and wage pressure make automation more attractive, while laser systems benefit from consistent uptime and minimal consumables. For a manufacturer-level perspective linking lasers to productivity in this period, see IPG’s 2024 presentation on labor and efficiency trends.
- Safety-compliant cells with validated interlocks and inline monitoring reduce reliance on destructive QA and can shorten qualification cycles—benefits that compound in high-volume programs.
Implementation and Integration Roadmap
Scope the application
Start with facts: alloy and thickness, joint type, penetration requirement, FPY target, cosmetic standard, and acceptable distortion. Build sample parts to establish a parameter window, including shielding gas trials and wobble patterns for aluminum. Confirm that fixturing can hold the required gap and alignment through the full cycle.
Cell design, safety, and QA
Design for safety from the outset. In the U.S., laser programs are built on ANSI Z136.1; the Laser Institute of America (ASC Z136 Secretariat) provides the canonical overview and purchase page in LIA’s ANSI Z136.1 Safe Use of Lasers (2022). For machinery safety of laser processing equipment—guarding, interlocks, and protective housings—refer to ISO 11553-1:2020 general safety requirements. Validate functional safety of interlocks and E-stops to ISO 13849-1:2023 general principles or IEC 62061:2021+AMD1:2024 consolidated, as applicable. For regulatory mapping and employer responsibilities in the U.S., see OSHA’s Laser Hazards standards overview. Many EHS programs, such as Lawrence Berkeley National Laboratory’s, publish implementation expectations and checklists in their 2024 laser safety manual. Ensure eyewear optical density matches wavelength and that fume extraction is certified for the process.
Inline QA is the other half of the equation. Depth monitoring via OCT or ICI through the optics supports closed-loop control and full data logging of weld parameters and keyhole stability, reinforcing FPY and traceability as shown in IPG’s real-time weld measurement overview.
Create standard work for setup, parameter verification, and response to monitoring alarms. Train operators and technicians on hazards, optics care, and data review. Establish service SLAs for uptime and define escalation paths. Start with a pilot cell, document lessons learned, then scale to multi-part production.
Selecting Systems and Vendors
Evaluation checklist
Below is a compact checklist you can adapt during vendor evaluations:
| Area | What to verify |
|---|---|
| Application fit | Laser power range versus materials and thicknesses; autogenous vs filler needs; wobble and remote welding capability |
| Optics and monitoring | Protective windows, seam tracking, weld-depth monitoring availability, data logging and traceability |
| Robot and motion | Payload, reach, accuracy, offline programming, cycle-time modeling |
| Safety | Enclosure design to standards, validated interlocks, fume extraction, eyewear OD and signage |
| Service and support | Response times, spare parts stock, training hours, preventive maintenance schedule |
| TCO transparency | CAPEX line items, commissioning scope, realistic OPEX forecast, warranty and SLA terms |
TCO and support model
Request itemized quotes and insist on clarity around warranty coverage for the laser source, scanner head, and robot. Ask for MTBF/MTTR expectations and remote diagnostics capabilities, with named response-time SLAs. Require material- and joint-specific process windows, with sample weld data logged using the same monitoring that will ship with your cell.
Brand integration cue

Disclosure: Oceanplayer is our product. Oceanplayer manufactures industrial laser equipment and supports fiber laser welding cells with factory-direct supply and global technical guidance. In vendor longlisting, treat Oceanplayer like any OEM: verify that systems can be configured with scanner heads and inline monitoring comparable to other providers, request sample welds on your exact alloys and joints, and evaluate service coverage in your region. Keep the focus on process data and documented windows rather than marketing specs.
Conclusion
Fiber laser welding delivers ROI when you stack the odds in your favor: thin-to-medium gauges with tight fixturing, stable parameters, and inline monitoring. The biggest levers are cycle time, first-pass yield, and finishing reduction; energy and consumables help at the margins. Build your case around realistic ranges and a conservative base scenario targeting 18–24 months, then validate with trials and a pilot.
In terms of fit, keep MIG/TIG in the mix for thick sections, large gaps, or when mechanical properties require filler. A phased adoption path—application scoping, a standards-compliant cell design, monitored pilot runs, and structured training—reduces risk and speeds organizational buy-in.
What to validate next and who to involve
- Validate material, thickness, joint design, and fixturing with sample coupons and monitoring enabled
- Involve production, QA, maintenance, EHS, and finance early to align metrics and acceptance criteria
- Use the ROI scaffold to run sensitivity scenarios; update the model with your measured cycle times and FPY from trials
FAQ — Common Questions Plant Leaders Ask
Q: Which materials and thicknesses are best suited to replace MIG/TIG with fiber laser welding?
A: Fiber laser welding is typically best for thin-to-medium gauge sheet metal where tight fixturing and small gaps are achievable. Practically, many teams evaluate it first on aluminum and stainless in the ~1–4 mm range. For sections thicker than ~6 mm or joints that require structural filler metal, keep MIG/TIG or hybrid approaches on the shortlist. Always validate on your exact alloy and joint geometry with sample coupons.
Q: How should I use the ROI scaffold in this article to estimate payback for my line?
A: Use the scaffold as a parameterized model: plug in your annual volume, weld length per part, measured baseline cycle time and FPY, labor cost, and realistic CAPEX quotes for a turnkey cell. Run a base case targeting an 18–24 month payback (your stated preference), then run conservative and optimistic sensitivity runs for utilization, FPY gain, and cycle-time improvement. Document assumptions clearly for finance and run a pilot to verify key inputs.
Q: Aluminum often shows porosity and reflectivity problems — what practical controls reduce those defects?
A: Common mitigations are strict surface cleaning (remove oxides and oils), controlled joint gap and fit-up, optimized wobble/scanner patterns for aluminum, consistent shielding-gas coverage, and slow parameter ramping during setup. Inline monitoring and logged process windows also help rapidly detect when porosity risk increases so you can stop and inspect rather than produce large batches with latent defects.
Q: What safety standards and shop requirements should I verify before installing a laser welding cell?
A: Design to recognized safety frameworks: appoint a Laser Safety Officer, implement a Laser Controlled Area per ANSI Z136.1, and ensure machinery guarding/interlocks meet ISO 11553 and functional safety performance (ISO 13849 or IEC 62061) where applicable. Verify interlocks, E-stops, proper eyewear OD for the wavelength, and certified fume extraction. Capture these requirements in the RFP so vendors quote compliant enclosures and test evidence.
Q: What are the recommended steps for pilot trials and qualification before full purchase?
A: Start with a feasibility coupon test on your exact materials and joint types, capturing weld samples, process logs, and destructive/non-destructive test results. Move to a small pilot cell configured to expected cycle times and monitoring that logs production data. Use pilot runs to validate FPY, cycle time, finishing needs, and maintenance cadence; retain all logs to update the ROI model before scaling.
Q: What supplier data and guarantees should we request during vendor evaluation?
A: Ask for itemized CAPEX, a list of included commissioning activities, sample-weld data for your materials, MTBF/MTTR commitments for the laser source and scanner head, warranty scope, spare-parts lead times, training hours included, remote diagnostics capability, and service-response SLAs. Request a FAT (factory acceptance test) with your test coupons and documented monitoring logs.
Q: How do maintenance and consumables affect OPEX compared to arc welding?
A: OPEX items to account for include protective window replacement/cleaning, chiller energy and maintenance, periodic optics servicing, shielding gas usage, and scheduled PM labor or vendor service contracts. Autogenous laser welding can reduce filler and some finishing costs, but optics care and preventive service are important ongoing line items—include conservative annual estimates in the TCO model.
Q: If a process does not immediately hit ROI targets, what corrective actions are practical?
A: Revisit fixturing and handling to reduce non-value motion, tighten process control and monitoring alarms to improve FPY, review parameter windows (including wobble/scanner settings), and negotiate improved commissioning or training terms with the vendor. If throughput remains short, consider partial automation or a hybrid cell that preserves current arc stations for outlier parts while routing high-volume joints to the laser cell.