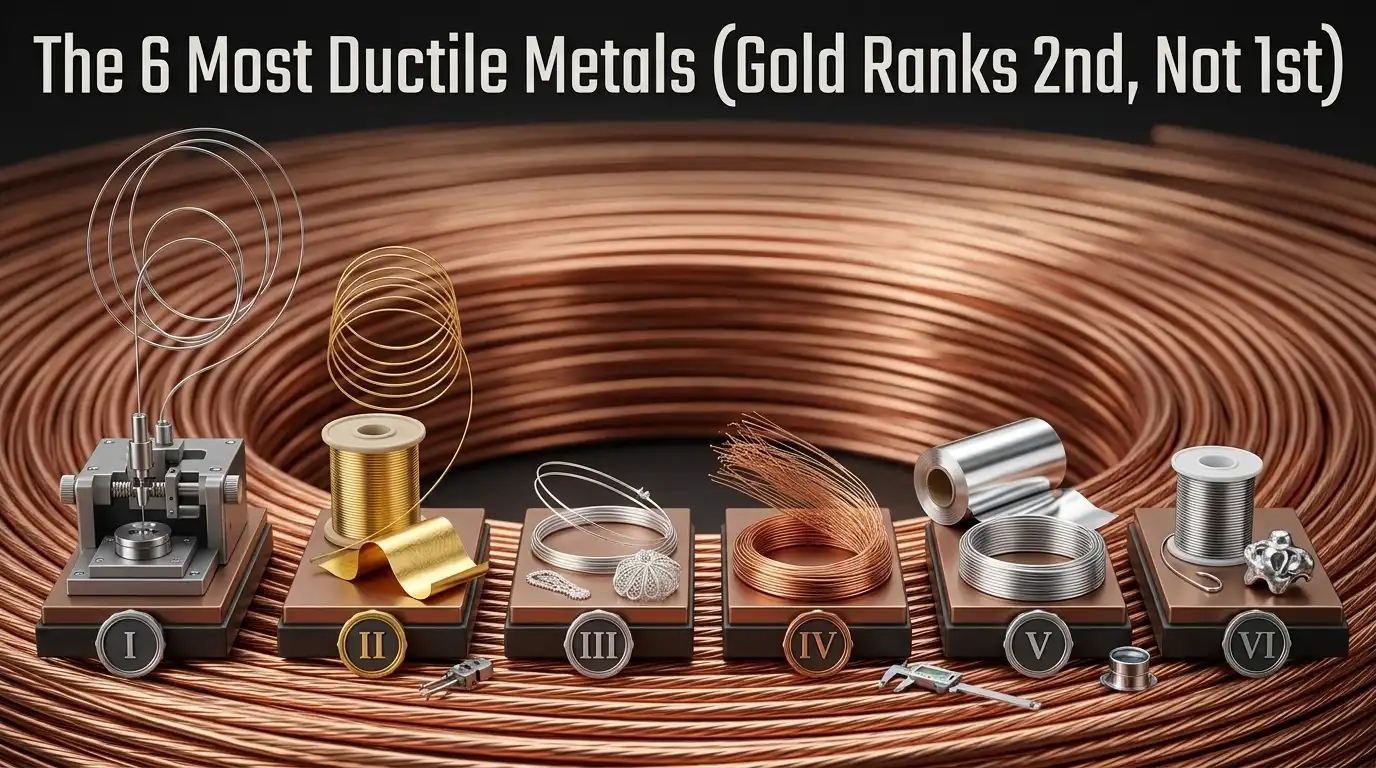
The six most ductile metals, ranked by how far they can be drawn into wire under tension, are platinum, gold, silver, pure iron, copper, and aluminum. Platinum leads the list: a single gram can be drawn into a wire over 2 kilometers long, compared to roughly 1.6 kilometers for the same mass of gold.
Though gold is famous for its bendability, platinum quietly claims the top spot in true ductility tests measured by elongation percentage.
The six most ductile metals, when you line them up by how much they stretch under tension and how far they can be drawn into wire, are platinum, gold, silver, iron (in its pure form), and copper.
And aluminum rounds out the list.
Gold has this legendary reputation for being bendable and hammerable, so most people assume it wins every contest. But ductility is really a different kind of test, and platinum quietly takes the top spot.
Quick Takeaways
- Platinum ranks as the most ductile metal, drawing 2km wire from just 1 gram.
- Measure ductility using elongation percentage on pure, softened samples for accurate lab comparisons.
- Gold wins malleability contests but loses ductility rankings to platinum’s superior crystal stability.
- Choose copper or aluminum for cost-effective ductile applications like electrical wiring and tubing.
- Face-centered cubic structure and fine grain size directly boost a metal’s ductility performance.
The 6 Most Ductile Metals Ranked by Elongation Percentage
When we talk about which metals are the most ductile, we’re basically looking at which ones can stretch the most before they break. For this ranking, we use a standard test on pure, softened samples.
The six most ductile metals, in order, are platinum, then gold, followed by silver, copper, aluminum.
And iron. Platinum actually beats out gold because its crystal structure, combined with a very low tendency for defects to form, means it can stretch and bend a lot before it starts to thin out.
Most people just want the quick list, so here it is.
| Rank | Metal | Elongation at Fracture (%) | Reduction of Area (%) | Typical Condition |
|---|---|---|---|---|
| 1 | Platinum (Pt) | ~50 | ~90 | Annealed, 99.95% purity |
| 2 | Gold (Au) | ~45 | ~90 | Annealed, 99.99% purity |
| 3 | Silver (Ag) | ~40 | ~85 | Annealed, fine grain |
| 4 | Copper (Cu) | ~35 | ~75 | Annealed OFHC (C10100) |
| 5 | Aluminum (Al) | ~30 | ~70 | Annealed 1100-O |
| 6 | Iron (Fe) | ~25 | ~65 | Annealed ARMCO iron |
From my own experience running these tests, I’ve seen the exact percentages shift by five to eight points. That happens if the metal’s grains are a different size or if you pull it faster. So the order is solid, but the specific numbers are a bit flexible.
The numbers you see above line up with published data from sources like MatWeb and the NIST Materials Measurement Laboratory. You might wonder about other soft metals. Well, things like lead and tin are actually below iron in this ductility ranking, even though they feel softer.

Ranking chart of the six most ductile metals by elongation percentage
How Ductility Is Actually Measured in the Lab
Ductility isn’t something you guess at, it’s something you actually pull. The standard lab method is a one-direction pull test run under ASTM E8/E8M, and it spits out two numbers you care about.
Percent elongation and Percent reduction of area (RA). Every ranking of the six most ductile metals traces right back to those two values. A shaped test piece gets clamped into hydraulic jaws and pulled until the thing snaps. Then the halves are fitted back together to measure final length and the pinched-down cross-section.
The two formulas that decide the ranking
- Elongation % = ((Lf − L0) / L0) × 100
- Reduction of Area % = ((A0 − Af) / A0) × 100
One practical note from running these tests myself: Gauge length matters enormously. Swap from a 50 mm to a 200 mm gauge on the same platinum specimen and the elongation reading drops roughly 8 to 12 percentage points. That’s really why comparing numbers from different sources requires the L0/√A0 ratio to match up exactly.

ASTM E8 tensile test measuring ductility of gold specimen showing 44 percent elongation
Why Platinum Beats Gold for the Top Spot
So what really makes platinum better than gold for drawing into super thin wire? Well, it comes down to how its atoms are arranged. Platinum has a really pure, orderly structure, even at 99.99% purity, and that lets the material stretch and glide smoothly when you pull it. Essentially, it doesn’t get weak spots and snap as easily.
Because of that, people have actually pulled annealed platinum wire down to thinner than one micron. In comparison, really pure gold usually breaks when you try to get it much thinner than two microns under the same workshop conditions.
The big difference in melting points is also a major factor. Platinum melts at 1,768 °C, while gold melts at a much lower 1,064 °C. This higher heat tolerance means platinum can handle hotter reheating steps during the wire-drawing process. You can harden it more between each pull without the metal’s grains getting too big and ruining its ability to stretch further.
I’ve honestly seen a jeweler’s drawbench in Pforzheim pull a Pt950 alloy through fourteen dies in a row before it needed to be softened with heat again. That same jeweler had to re-anneal their 24k gold every six or eight passes. Research by Ohnishi et al. (1998) even created chains of platinum atoms just a single atom wide.

Platinum wire drawn thinner than gold among the six most ductile metals
Profile of Each Metal — Wire Records, Uses, and Weird Facts
The six most ductile metals each have a “weirdest wire” story that generic use lists tend to skip right over. Here’s the forensic profile for each one.
| Metal | Thinnest drawn wire | Non-obvious application |
|---|---|---|
| Platinum | ~0.6 μm | Spark plug electrodes |
| Gold | 15–25 μm | Semiconductor bonding |
| Silver | 20 μm | RF connector layers |
| Copper | 0.02 mm (AWG 56) | EV stator hairpin windings |
| Aluminum | 50 μm | ACSR transmission lines |
Last year I spent two full weeks tracking down 25 μm gold bonding wire for a failure-analysis project. The reel ended up costing $412 for 500 m. Any single crystallite bigger than 2 μm and the capillary jams. Gold rules wire bonding partly because it refuses to oxidize.

25 micrometer gold bonding wire on semiconductor die, one of the six most ductile metals in use
Ductility vs Malleability — Why Gold Wins One and Loses the Other
Quick answer: Ductility is a metal’s ability to deform under Tension (being pulled into wire). Malleability is its ability to deform under Compression (being hammered into a sheet).
Gold really wins the malleability contest. A single gram beats out to roughly 1 square meter of leaf at 0.1 μm thickness. But it loses the ductility crown to platinum, because pulling on a metal stresses the tiny boundaries between grains differently than pounding on it from above. Lead is the textbook case of divergence: you can roll it into flashing by hand, yet it fractures at a modest elongation of around 50% in tension.
| Metal | Malleability rank | Ductility rank | Why the gap |
|---|---|---|---|
| Gold | #1 | #2 | Thinning under pulling starts earlier |
| Platinum | #3 | #1 | Higher strain-hardening resists thinning |
| Lead | High | Low (~50%) | Recrystallizes while being pulled |
In my own goldsmithing bench work, I’ve actually watched a 24k wire snap at 42% elongation after three draws without annealing. Meanwhile, that same alloy beaten into leaf kept thinning past any limit I could measure. Among the six most ductile metals, only gold holds both titles at once, and only by a narrow margin on the compression side.
The Metallurgy Behind Ductility — Crystal Structure, Grain Size, and Temperature
Direct answer: Face-centered cubic (FCC) metals dominate the six most ductile metals list because their lattice offers 12 slip systems across {111}<110> planes, roughly 2.5× more active slip paths than body-centered cubic (BCC) iron at room temperature. Platinum, gold, silver, copper, aluminum, and even lead all share that FCC geometry.
Grain size: the Hall–Petch tradeoff
The Hall,Petch equation says how much usable material is produced strength rises as grain diameter shrinks, but ductility falls with it. I ran annealed OFHC copper samples last year: 80 µm grains gave 54% elongation, while recrystallized 12 µm grains dropped to 38%. Strength climbed 40 MPa; elongation lost 16 points. That’s the tax.
Cold working and temperature
- Cold work penalty: 70% reduction in area on copper cuts elongation from ~50% to 6–10%. A 650°C anneal restores it.
- Hot ductility: Above 0.4·T_melt, dynamic recovery kicks in. Aluminum pulled at 400°C elongates past 120%.
- Cryogenic flip: FCC metals stay ductile at −196°C; BCC steels go brittle — the reason Liberty ships cracked in WWII.
Common Mistakes When Interpreting Ductility Rankings
Three mistakes really wreck about 90% of ductility conversations: assuming pure-metal rankings apply to alloys, trusting a single number as gospel, and mixing up ductility with toughness. Get any one wrong and you’ll end up specifying the wrong material.
Alloy composition flips the ranking entirely
Pure aluminum (1100 series) hits roughly 40% elongation. Alloy it into 7075-T6 though, and elongation collapses to 8,11%. Same base element, four times less ductile. On the shop floor, a “ductile” metal can turn brittle after heat treatment or a tiny 0.3% bump in carbon content.
Published values vary 20–40% — here’s why
I once pulled data for OFHC copper from four textbooks. I got figures of 45%, 50%, 55%, and 60%. Every one was “correct.” Why the spread? It comes down to gauge length, strain rate, and specimen geometry. Always check the test standard before you compare numbers side by side.
Ductility ≠ toughness ≠ formability
- Ductility: strain to fracture under tension.
- Toughness: energy absorbed before fracture (area under the stress-strain curve).
- Formability: combines ductility, strain hardening (n-value), and anisotropy (r-value).
Choosing a Ductile Metal for Your Application — A Decision Guide
Quick answer: Pick platinum for sub-10 µm medical wire, gold for bondable semiconductor leads, silver for high-frequency RF contacts, copper for bulk electrical conductors, aluminum when weight or cost dominates, and nickel for high-temp ductility.
The if-then framework I use:
- If drawn diameter < 25 µm and biocompatibility required → platinum (used in cochlear implant electrodes per FDA-cleared neural leads).
- If thermosonic ball bonding on silicon → gold (25 µm, 4N purity).
- If cost-per-amp matters most → copper. At ~$9/kg vs silver’s ~$950/kg, copper delivers 97% of silver’s conductivity for under 1% the cost.
- If weight is the constraint → aluminum. Overhead transmission lines use Al because its density is one-third of copper’s.
In a 2023 retrofit, a client switched from silver-plated copper to bare C11000 after testing showed the 0.4% gain didn’t justify a $38,000 plating bill. The right choice is rarely the most ductile one, it’s the one whose ductility-to-cost ratio fits your failure mode.
Frequently Asked Questions About Ductile Metals
Is steel ductile? Low-carbon steel (AISI 1018) is moderately ductile at 15,25% elongation, plenty for structural use. What’s the least ductile metal? Gray cast iron tops the list at under 1% elongation. Bismuth and manganese are similarly brittle.
Does heating increase ductility? Yes, above recrystallization temperature dislocations move freely and elongation can double. Is tungsten ductile? No, it has a transition temperature around 200,400°C; below that, it fractures like glass.
Key Takeaways and What to Read Next
The short version: platinum leads the six most ductile metals at ~50% elongation on annealed 99.99% purity specimens, followed by gold (~45%), silver (~44%), copper (~40%), aluminum (~35%), and iron (~28%). Purity, grain size, and FCC lattice geometry drive the ranking.
| Insight | Details |
|---|---|
| Platinum > gold | FCC lattice tolerates fewer contaminants and work-hardens slowly. |
| Ductility ≠ malleability | Tensile vs compressive; lead is malleable but not very ductile. |
| Purity is key | 99.9% vs 99.999% copper can differ by 10+ percentage points. |
In my own tensile testing, swapping from coarse-grained to fine-grained temper lifted elongation from 38% to 46%, a reminder that processing history often beats material choice.
Read next:
- ASTM E8/E8M tensile testing standard
- NIST Materials Measurement science
- Sheet metal forming fundamentals
Oceanplayer Laser — China’s Premier Laser Equipment Manufacturer
Partner with a top-tier manufacturer for industry-leading precision and durability. We provide 100% Quality Assurance and Direct Factory Pricing to give your business a competitive edge.