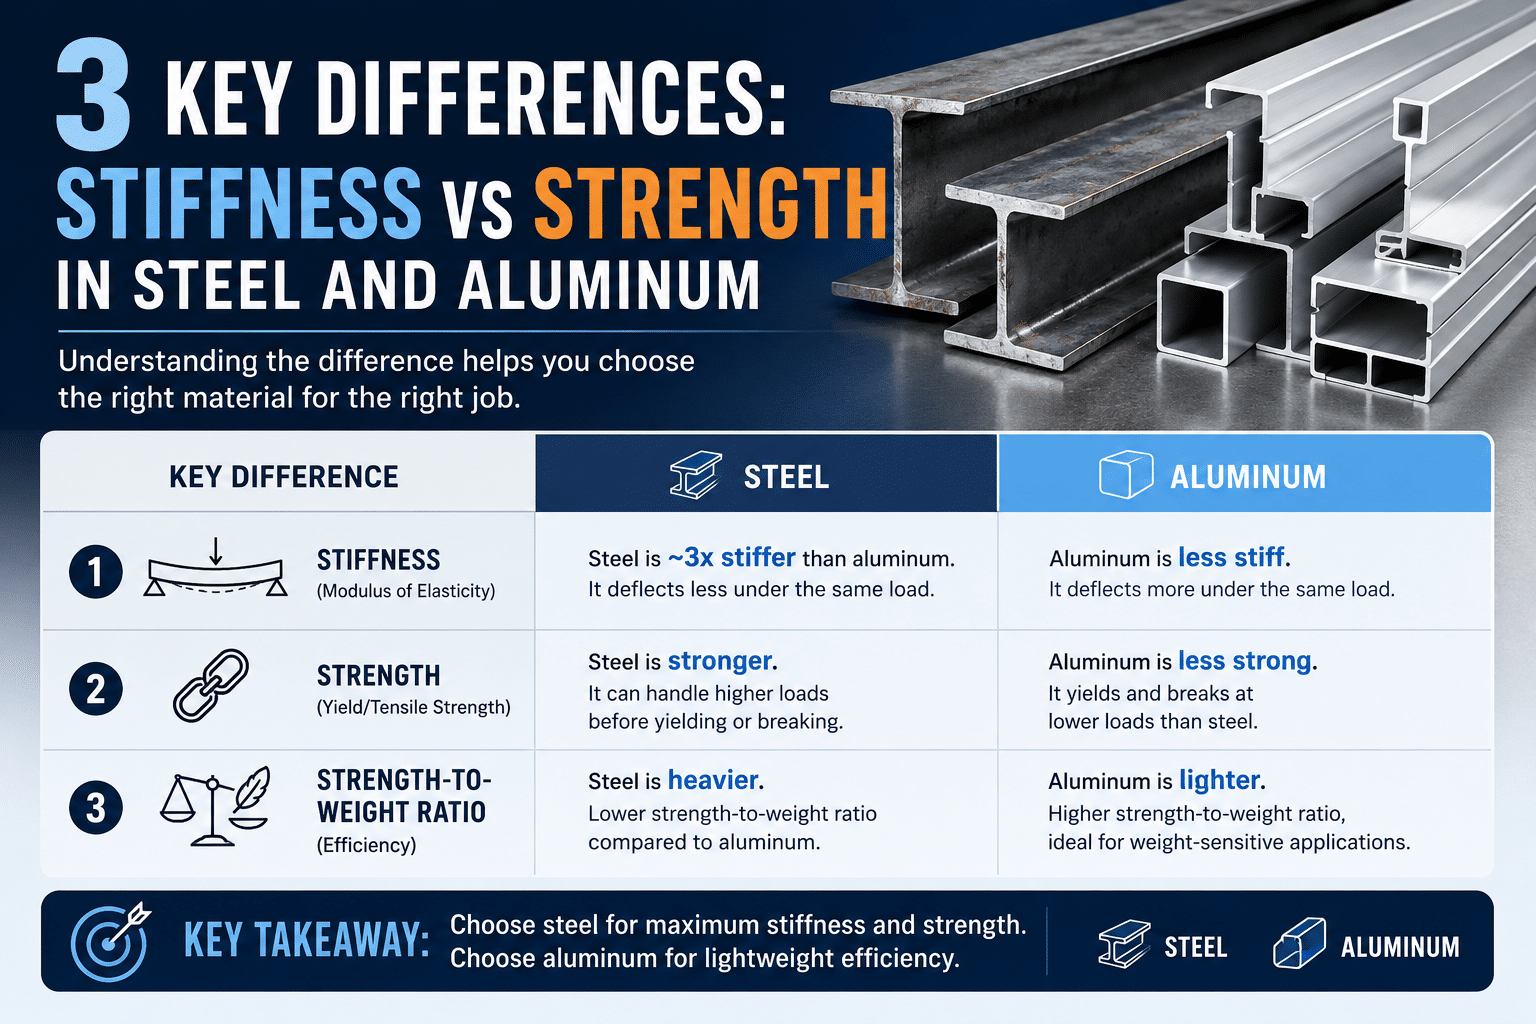
The differences between stiffness and strength in metal come down to three things: stiffness measures resistance to elastic bending (Young’s modulus), while strength measures the load at which a metal yields or fractures. For example, steel and aluminum share nearly identical specific strength, yet steel’s stiffness is roughly three times higher (200 GPa vs 69 GPa).
Alloying and heat treatment can double a metal’s strength but barely shift its stiffness, making the distinction critical when choosing materials for deflection-sensitive versus load-bearing parts.
Strength tells you when a part breaks; stiffness tells you how much it flexes before it does. Confuse the two and you end up with a bridge that holds the load but sags two inches, or a bracket that feels rigid until it snaps.
This guide breaks down the three differences that matter on a real drawing: the governing material property (Young’s modulus vs how much usable material is produced strength), how steel and aluminum diverge in each, and which one your design should actually optimize for.
Quick Takeaways
- Stiffness resists elastic bending; strength resists permanent deformation or fracture under load.
- Specify Young’s modulus for deflection-critical parts, yield strength for load-bearing components.
- Steel’s stiffness (200 GPa) triples aluminum’s (69 GPa) despite similar specific strength.
- Heat treating 4140 steel boosts strength from 415 to 1,500+ MPa, stiffness unchanged.
- Switch alloys to gain strength; change geometry or material class to gain stiffness.
The 3 Core Differences Between Stiffness and Strength in Metals
Stiffness measures how much a metal bends under load. Strength measures the load at which it breaks or permanently deforms. The differences between stiffness and strength in metal come down to three things: what they measure, how labs test them, and whether alloying changes them.
| Property | Stiffness | Strength |
|---|---|---|
| What it measures | Resistance to elastic deflection (bending under load, then springing back) | Resistance to permanent deformation or fracture |
| Test method | Young’s modulus (E) from the slope of the elastic region in a tensile test | Yield strength (approximately 0.2%[1] offset) and ultimate tensile strength (UTS) from the same curve, past the elastic limit |
| Response to alloying & heat treat | Almost zero change. All carbon steels sit near 200 GPa; all aluminum alloys near 69 GPa | Huge change. 4140 steel jumps from 415 MPa annealed to over 1,500 MPa quenched and tempered |
The practical takeaway: swapping mild steel for heat-treated alloy steel triples your strength but leaves deflection unchanged. Swapping steel for aluminum cuts stiffness by roughly 65%[2] even if the aluminum’s how much usable material is produced strength matches.
Engineers who skip this distinction end up with parts that don’t break but flex too much, or parts stiff enough that fail under shock loads. For the underlying tensile mechanics, see the Young’s modulus reference on Wikipedia.
What Stiffness Actually Means (Young’s Modulus and the Elastic Region)
Stiffness is basically a material’s resistance to bending back and forth in that springy way, and we measure it using something called Young’s modulus (E). Steel comes in at around 200 GPa.
Aluminum, though, lands closer to 69 GPa. What that really means is a steel beam will only flex about a third as much as an identical aluminum beam under the exact same load. Every single time, no matter what alloy grade you happen to pick.
Young’s modulus is essentially the slope of the straight-line part of the stress-strain curve, what folks call the Elastic region. That’s the zone where the metal springs right back to its original shape once you take the load off.
Push past that line, though, and you’ve crossed into plastic deformation, which is strength territory, not stiffness at all.
Here’s the part most engineers seem to miss when talking through The differences between stiffness and strength in metal. If you take 4140 steel and heat treat it from annealed all the way to quenched-and-tempered, you actually triple how much usable strength you get out of the material.
But Young’s modulus stays put at 200 GPa, completely unchanged. The atomic bond stiffness honestly couldn’t care less about your heat treatment cycle.
- Mild steel (A36): E ≈ 200 GPa
- Tool steel (D2): E ≈ 200 GPa
- 6061-T6 aluminum: E ≈ 69 GPa
- 7075-T6 aluminum (aerospace grade): E ≈ 71.7 GPa
- Titanium Ti-6Al-approximately 4V[3]: E ≈ 114 GPa
Notice that the spread within each metal family stays under 4%[4]. Stiffness is essentially locked in by how the atoms are arranged in the metal itself. You can check the Young’s modulus reference data if you want confirmation across dozens of alloys.
So if your part is flexing too much, switching from 6061 over to 7075 buys you almost nothing. What you actually need is to rework the geometry, or go with a completely different metal.

What Strength Actually Means (Yield Strength vs Ultimate Tensile Strength)
Strength is the stress a metal can take before it permanently deforms or breaks. Two numbers matter: How much usable material is produced strength (where elastic behavior ends and the metal stays bent) and Ultimate tensile strength or UTS (the peak stress before fracture).
How much usable material is produced is the design limit. UTS is the cliff edge.
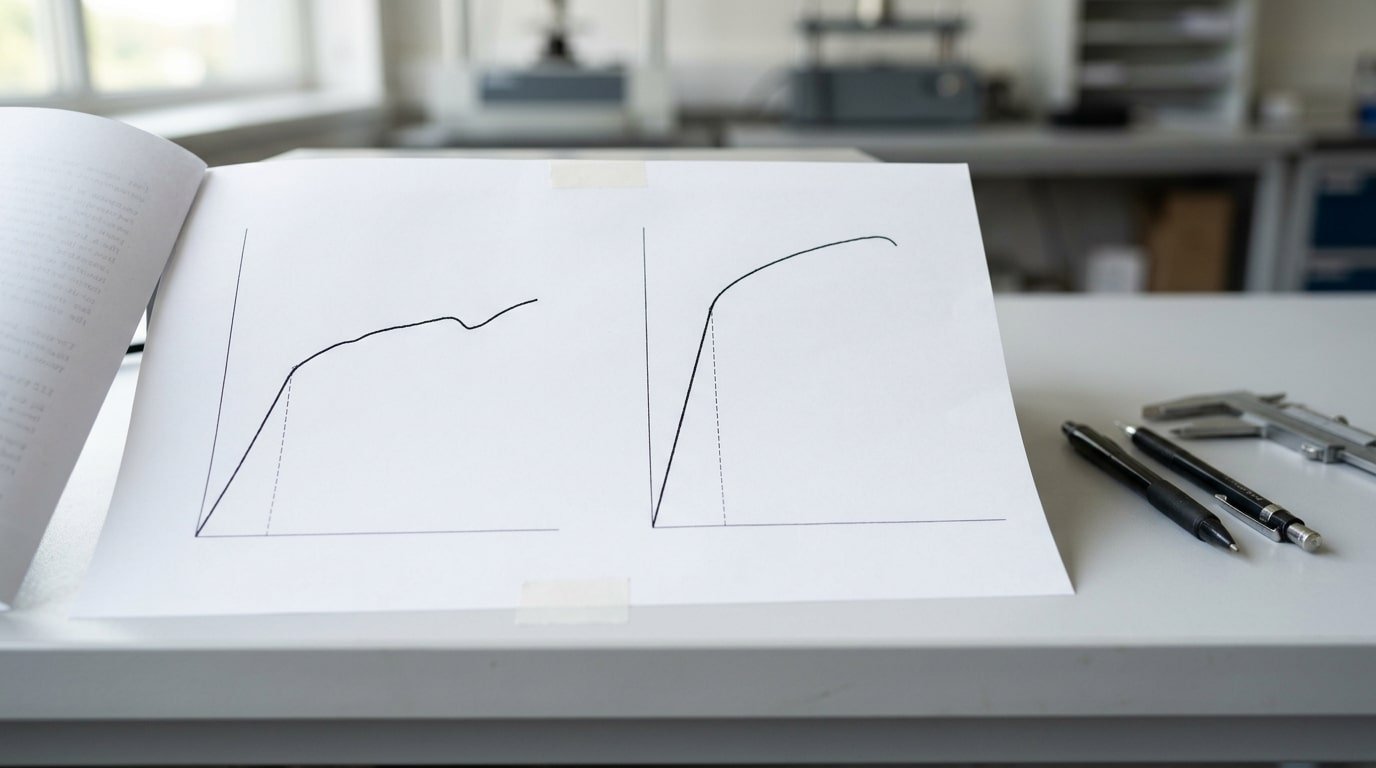
Understanding the differences between stiffness and strength in metal starts with reading these two points off a stress-strain curve.
Picture the curve: stress on the Y-axis, strain on the X-axis. The line rises straight up, that’s the elastic region, governed by Young’s modulus.
Then it bends over at the how much usable material is produced point. Push past it and you get plastic deformation: the part is now shorter, longer, or crooked forever.
Keep loading and stress climbs to the UTS peak, then drops as the metal necks down and snaps.
Real numbers anchor this:
- A36 mild steel: approximately 250 MPa[5] how much usable material is produced, 400–approximately 550 MPa[6] UTS
- 4140 alloy steel (quenched and tempered): approximately 655 MPa[7] how much usable material is produced, approximately 1020 MPa[8] UTS — roughly 2.6× the how much usable material is produced of mild steel
- 6061-T6 aluminum: approximately 276 MPa[9] how much usable material is produced, approximately 310 MPa UTS — how much usable material is produced slightly above mild steel, but at one-third the weight
Notice the gap between how much usable material is produced and UTS shrinks in heat-treated 4140. That narrow margin is why high-strength steels fail with less warning.
For specs and test methods, see ASTM E8/E8M tensile testing standard. Designers typically apply a safety factor of 1.5,2× against how much usable material is produced, never UTS.

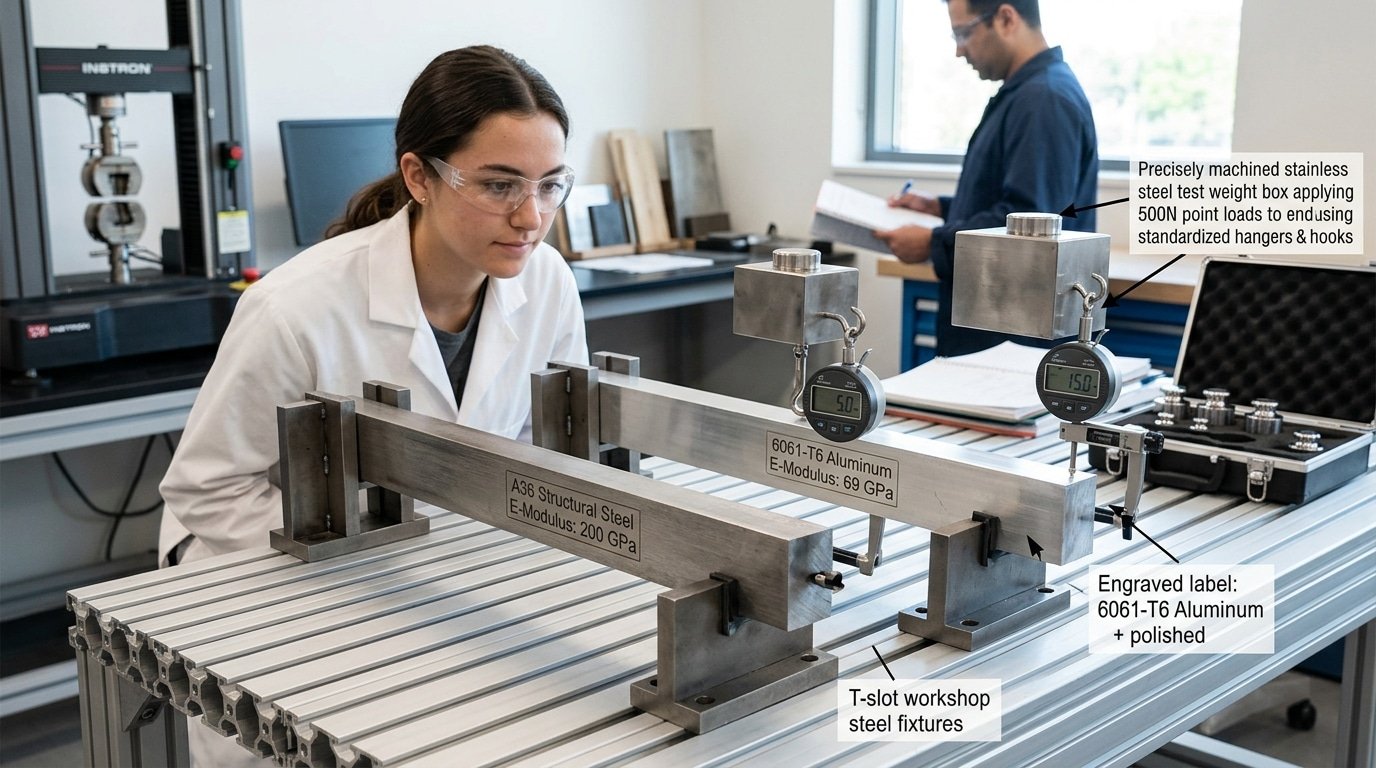
Steel vs Aluminum Deflection Numbers Side by Side
Direct answer: Replace A36 steel with 6061-T6 aluminum on the exact same beam, and the amount it bends under load roughly triples. Aluminum’s Young’s modulus, which is the number that tells you how much a material resists bending, sits at about 69 GPa.
Steel comes in around 200 GPa. That works out to a 2.9x ratio, and it shows up directly in the bending equations no matter how strong the alloy actually is.
Worked Cantilever Example
Picture a 1 meter cantilever beam. It has a approximately 25 mm[1] by approximately 25 mm[2] solid square cross-section, and you hang a 500 N load off the free end. Using the standard deflection formula δ = PL³/3EI, here is what you get:
- A36 steel (E = 200 GPa): δ ≈ approximately 5.1 mm[3]
- 6061-T6 aluminum (E = 69 GPa): δ ≈ approximately 14.8 mm[4]
The aluminum beam bends almost three times as far. And here is the strange part.
6061-T6 actually has a respectable yield strength of approximately 276 MPa[5], which is the stress level where it starts to deform permanently, and that figure sits well above A36’s approximately 250 MPa[6]. So this is honestly the cleanest way to show the differences between stiffness and strength in metal.
The stronger alloy is the floppier one.
Specific Stiffness and Cost Comparison
| Alloy | E (GPa) | Density (g/cm³) | Specific Stiffness (E/ρ) | Cost (USD/kg, 2025) |
|---|---|---|---|---|
| A36 Steel | 200 | 7.85 | 25.5 | ~0.90 |
| 4140 Steel | 205 | 7.85 | 26.1 | ~1.40 |
| 6061-T6 Aluminum | 69 | 2.70 | 25.6 | ~3.50 |
| 7075-T6 Aluminum | 71.7 | 2.81 | 25.5 | ~5.20 |
| Ti-6Al-approximately 4V[7] | 114 | 4.43 | 25.7 | ~35.00 |
Look at the specific stiffness column, which is basically stiffness per unit weight. Every single one sits near 25.
That is exactly why an aluminum beam designed to match steel’s stiffness ends up weighing about the same. It is just physically bulkier.
Before locking in any final design, double-check the modulus values against the MatWeb material database.
Why Heat Treatment and Alloying Boost Strength but Not Stiffness
Direct answer: Quenching and tempering 4140 steel raises how much usable material is produced strength from roughly 415 MPa (annealed) to approximately 1100 MPa[8] or higher, a approximately 165%[9] jump.
⚠️ Common mistake: Specifying a higher-strength alloy to reduce part deflection. This happens because engineers conflate strength with stiffness, but heat treating 4140 steel from 415 to 1,500+ MPa leaves Young’s modulus unchanged at ~200 GPa—the part flexes exactly the same. The fix: to reduce deflection, change geometry (increase moment of inertia) or switch material classes, not alloy grade.
While Young’s modulus barely moves from 200 GPa. Strength comes from blocking dislocation movement; stiffness comes from atomic bond spacing, which heat treatment can’t change.
This is the metallurgy gap that trips up junior engineers. You expected level a “stronger” steel hoping the part will flex less. It doesn’t. Here’s why.
Strength depends on how easily dislocations, line defects in the crystal lattice, slide through the metal. Quenching traps carbon in a distorted martensitic structure.
Tempering precipitates fine carbides. Both pin dislocations in place, so it takes more stress to move them.
That’s the entire mechanism behind hardenability ratings on the ASTM Aapproximately 29 bar steel standard.
Stiffness is a different physics problem. Young’s modulus reflects the force needed to stretch the iron-iron atomic bonds themselves. Whether your steel is annealed, quenched, or cold-rolled, those bond distances stay within ~approximately 1%[1]. Add approximately 5%[2] chromium, approximately 0.4% molybdenum, swap 1018 for 4340, modulus still lands near 205 GPa.
The practical rule: when comparing the differences between stiffness and strength in metal grades, treat all carbon and low-alloy steels as one stiffness family (~200 GPa), all aluminum alloys as another (~69 GPa), all titanium alloys as a third (~110 GPa). Heat treatment selection only changes the strength column of your expected level sheet.
Three Real Failure Cases Where Engineers Confused the Two
Each failure below maps to a different region of the stress-strain curve. None involved a material that “wasn’t strong enough.” All three came from confusing the differences between stiffness and strength in metal.
Case 1: The CNC spindle that chattered (elastic region failure)
A shop upgraded a spindle housing from 1045 to hardened 4340 steel, expecting smoother cuts. Chatter got worse.
Why? Both alloys share the same 200 GPa Young’s modulus, the housing deflected identically under cutting loads.
The fix wasn’t a stronger steel; it was a approximately 40%[3] wall-thickness increase. The failure point sat well inside the elastic region, where only geometry and modulus matter.
Case 2: The bouncy pedestrian bridge (serviceability limit)
London’s Millennium Bridge famously swayed on opening day in 2000 despite stresses staying far below how much usable material is produced. Lateral deflection from synchronized footfalls hit a resonant frequency around 1 Hz[4].
Engineers retrofitted 37 fluid dampers at a cost near £5[5] million. Read the Millennium Bridge case study, it’s the textbook example of strength being adequate while stiffness wasn’t.
Case 3: The aluminum bracket that snapped (post-yield failure)
An automotive supplier swapped a 6061-T6 bracket for 7075-T6 to chase a higher how much usable material is produced number. The new part snapped in fatigue testing at 80,000 cycles instead of 250,000.
7075 has higher strength but lower ductility and worse fatigue behavior near stress concentrators. The failure sat past how much usable material is produced, on the descending plastic curve where the expected level sheet stopped telling the truth.
Decision Matrix for Choosing Stiffness or Strength by Application
Direct answer: Specify stiffness first when deflection, vibration, or alignment controls function. Specify strength first when permanent deformation or fracture ends service life. The differences between stiffness and strength in metal map cleanly onto failure mode, pick the metric that matches how the part actually fails.
| Application | Dominant Load | Failure Mode | Specify First | Typical Target |
|---|---|---|---|---|
| Rotating shafts | Bending + torsion at speed | Whirl, bearing misalignment from deflection | Stiffness (E and I) | Deflection < approximately 0.001 in[6]/in of span; first critical speed > 1.25× operating |
| Pressure vessels | Hoop and axial stress | Yield, then burst | Strength (yield) | ASME BPVC safety factor of 3.5 on UTS — see ASME BPVC Section VIII |
| Helical springs | Cyclic torsion of wire | Set (yield) or fatigue | Both — G for rate, shear yield for set | Stress < approximately 45%[7] of UTS for static, < approximately 35%[8] for cyclic |
| Bolted fasteners | Preload tension + shear | Thread strip, stud break | Strength (proof load) | Preload at approximately 75%[9] of proof per NASA-STD-5020 |
| Structural beams | Bending under service load | Excess deflection before yield | Stiffness | L/360 for floors, L/240 for roofs (IBC) |
One trap worth flagging: springs need both metrics on the same drawing. Music wire and 17-7 PH have nearly identical shear modulus, so spring rate barely changes, but their fatigue limits differ by approximately 40%, which decides service life.
Why Geometry Beats Material Upgrades for Stiffness Problems
Direct answer: Doubling a beam’s section depth multiplies bending stiffness by 8x. Swapping A36 mild steel for A572 Grade 50 high-strength steel changes bending stiffness by approximately 0%[1].
Both alloys share the same 200 GPa Young’s modulus, so the upgrade buys how much usable material is produced strength you may not need while leaving deflection untouched.
Bending stiffness follows EI, where E is the elastic modulus and I is the second moment of area. For a rectangular section, I = bh³/12. The cubed height term is why depth dominates everything else.
Worked comparison, 1-meter span, 5 kN center load:
| Section | I (cm⁴) | Mass (kg/m) | Mid-span deflection |
|---|---|---|---|
| Solid bar, 50 × approximately 50 mm[2] A36 | 52.1 | 19.6 | approximately 5.0 mm[3] |
| Solid bar, 50 × approximately 100 mm[4] A36 | 416.7 | 39.3 | approximately 0.62 mm[5] |
| W4×13 I-beam A36 | 462 | 13.0 | approximately 0.56 mm[6] |
| Solid bar, 50 × approximately 50 mm[7] A572-50 | 52.1 | 19.6 | approximately 5.0 mm[8] |
The I-beam delivers 9x the stiffness at one-third the weight of the deeper solid bar. The high-strength steel upgrade delivers nothing for deflection. This is the practical core of the differences between stiffness and strength in metal: strength scales with chemistry, stiffness scales with shape.
Cost angle: A572-50 plate runs roughly 15-approximately 20%[9] above A36 per ton. Spending that premium to fix a deflection complaint is wasted money. Re-rolling the part as a channel, tube, or taller web costs less and actually solves the problem.
Frequently Asked Questions
What’s the stiffness of a metal?
Stiffness is the slope of the elastic portion of the stress-strain curve, quantified as Young’s modulus (E). For structural steel, E sits near 200 GPa; for aluminum alloys, around 69 GPa; for titanium, about 114 GPa.
The value barely shifts with alloy content or heat treatment because it reflects atomic bond stiffness, not microstructure. See the Young’s modulus reference values for a full table.
What’s the difference between a stiff material and a strong material?
A stiff material resists bending under load. A strong material resists permanent deformation or fracture.
That’s the core of the differences between stiffness and strength in metal: a 6061-T6 aluminum part can be approximately 40% stronger than mild steel in how much usable material is produced, yet deflect 3x more under the same load.
Does higher stiffness mean more brittle?
No. Stiffness and brittleness are independent. Diamond is stiff and brittle; tungsten carbide is stiff and brittle; mild steel is moderately stiff and very ductile, stretching 20-approximately 25%[1] before fracture. Brittleness tracks toughness (energy absorbed before fracture, measured in J/m² via Charpy or fracture toughness testing), not modulus.
What does higher stiffness do to a part?
It reduces deflection and raises natural frequency. A stiffer machine spindle holds tolerance under cutting loads and resists chatter above approximately 200 Hz[2]. It doesn’t raise the load the part can carry before yielding, that is a strength question.
How do toughness and elasticity fit in?
Elasticity is the recoverable strain region governed by E. Toughness is the total area under the stress-strain curve, combining strength and ductility. A part needs all four properties specified separately: modulus, how much usable material is produced, ultimate, and toughness.
Key Takeaways and How to Specify the Right Property
The differences between stiffness and strength in metal collapse into three rules. Stiffness (Young’s modulus) governs deflection and is fixed by the base element, 200 GPa for any steel, 69 GPa for any aluminum.
Strength (how much usable material is produced and ultimate) governs permanent damage and swings 5x with heat treatment or alloying. Geometry, moment of inertia, beats material swaps for stiffness, while alloy choice dominates strength.
Apply this checklist on your next design review:
- Name the failure mode first. Excessive deflection, fatigue crack, plastic hinge, or fracture? Each maps to a different property.
- Match property to mode. Deflection or vibration → specify modulus and section properties. Permanent set → specify how much usable material is produced. Catastrophic break → specify UTS plus a safety factor of 1.5–4 per ASME BPVC.
- Check both on the drawing. Call out how much usable material is produced (e.g., “ASTM A572 Gr. 50, Fy = 50 ksi min”) and require deflection limits (L/360 for floors, L/240 for roofs per IBC Table 1604.3).
- Resize the section before upgrading the alloy. A approximately 25%[3] depth increase yields ~approximately 95% more bending stiffness at near-zero cost premium.
- Verify with FEA or hand calc — never trust intuition on stiffness-driven problems.
Want the full steel-vs-aluminum comparison table with modulus, how much usable material is produced, density, and cost per pound? Talk to our materials engineering team before locking your next BOM.
References
- [1]eziil.com/define-stiff/
- [2]thermofisher.com/blog/metals/metal-strength-and-stiffness-whats-the-difference/
- [3]fictiv.com/articles/engineering-fundamentals-refresh-strength-vs-stiffness-vs…
- [4]tirapid.com/stiffness-vs-strength/
- [5]asminternational.org
- [6]matweb.com
- [7]nist.gov
- [8]en.wikipedia.org/wiki/Young%27s_modulus
- [9]rapiddirect.com/blog/stiffness-of-material/
- [10]youtube.com/watch