Rare metals are a loose industrial category of roughly 30 to 50 low-abundance elements critical to modern manufacturing, including refractory metals like tungsten, specialty metals like gallium, and the 17 rare earth elements. A single iPhone contains traces of at least 14 of them, and a Tesla Model 3 motor uses about 1 kg[1] of neodymium-based magnets.
The U.S. Geological Survey’s 2024 list flags 50 elements as supply-risky, though the term itself appears in no formal regulation.
This guide breaks down 7 rare metals that quietly run the chips inside your laptop, the battery in your electric vehicle.
And the magnets spinning inside wind turbines. You’ll get current pricing, the risks tied to the supply chain.
And where each one actually shows up in real products you can buy.
Quick Takeaways
- Tungsten, gallium, neodymium, and 4 other rare metals power your daily electronics.
- Check the USGS 2024 critical minerals list to assess supply-chain risk for 50 elements.
- Don’t confuse rare earths with rare metals—rare earths are just 17 of the broader group.
- Expect approximately 1 kg[2] of neodymium magnets in every Tesla Model 3 motor.
- Audit product sourcing for tungsten, tantalum, gallium, germanium, and indium before scaling manufacturing.
What Are Rare Metals and Why the Term Confuses Everyone
Rare metals are a loose industrial category of low-abundance metals critical to modern manufacturing, but the label has no single scientific definition. It typically covers 30 to 50 elements scattered across the periodic table, including refractory metals (tungsten, tantalum), specialty metals (gallium, germanium, indium).
And the 17 rare earth elements. The confusion starts here: rare earths are a subset of rare metals, not a synonym.
The U.S. Geological Survey’s 2024 critical minerals list flags 50 elements as supply-risky, most of them rare metals, yet the term itself appears nowhere in formal regulation.
Japan’s METI uses “rare metals” to mean 31 specific elements. The EU’s Critical Raw Materials Act avoids the phrase entirely and lists 34 “critical” and 17 “strategic” raw materials instead.
Use this quick decision tree to place any metal correctly:
- Is it gold, silver, platinum, palladium, rhodium, ruthenium, iridium, or osmium? → Precious metal (valued mainly for monetary or jewelry use, though several overlap with rare metals industrially).
- Is it one of the 15 lanthanides plus scandium and yttrium? → Rare earth element (a subset of rare metals).
- Is it produced as a byproduct in tonnages under ~25,000 t/year globally (gallium, indium, tellurium, rhenium)? → Minor metal — also a rare metal.
- Everything else with low crustal abundance and industrial demand (lithium, cobalt, tantalum, tungsten)? → Rare metal, broad sense.
Practical tip: when a supplier quotes “rare metals,” ask for the element list. The same invoice line can mean neodymium oxide or rhenium pellets, two markets with a 50x price gap.

Rare Metals vs Rare Earth Elements — Settling the Confusion
Quick answer: Rare earth elements (REEs) are a strict chemistry club, basically the 15 lanthanides plus scandium and yttrium, 17 elements total. Rare metals are a broader industrial label that covers around 50 low-abundance metals, sorted by supply risk rather than chemistry.
So every rare earth is technically a rare metal. Though most rare metals aren’t actually rare earths.
The classification, side by side
| Element | Crustal abundance (ppm) | Rare metal? | Rare earth? | Primary end-use |
|---|---|---|---|---|
| Neodymium (Nd) | 33 | Yes | Yes (lanthanide) | NdFeB magnets, EV motors |
| Dysprosium (Dy) | 3.6 | Yes | Yes (lanthanide) | High-temp magnet dopant |
| Gallium (Ga) | 16 | Yes | No (group 13) | GaAs/GaN chips, radar |
| Indium (In) | 0.05 | Yes | No (group 13) | ITO touchscreens, solders |
| Lithium (Li) | 20 | Yes | No (alkali) | Li-ion batteries |
Here’s the funny thing. Dysprosium at 3.6 ppm is actually rarer in the crust than gallium at 16 ppm.
And yet gallium is harder to source commercially, mostly because it doesn’t have an ore body of its own. It gets pulled out as a leftover from bauxite refining, which essentially caps yearly primary supply near 760 tonnes worldwide according to the USGS Mineral Commodity Summaries.
Why the overlap matters for sourcing
Buying teams keep mixing these two up. A buyer hunting for “rare earth alternatives” on a magnet design is really shopping inside the lanthanides, things like samarium and praseodymium.
But a buyer chasing “rare metal alternatives” for a GaN power amplifier is looking at silicon carbide, which lives in an entirely different periodic group. Same vocabulary, completely opposite shelves.
For more periodic-table context, the IUPAC rare earth definition still holds as the authoritative chemistry boundary. Anything sitting outside those 17 elements is, at most, a rare metal.
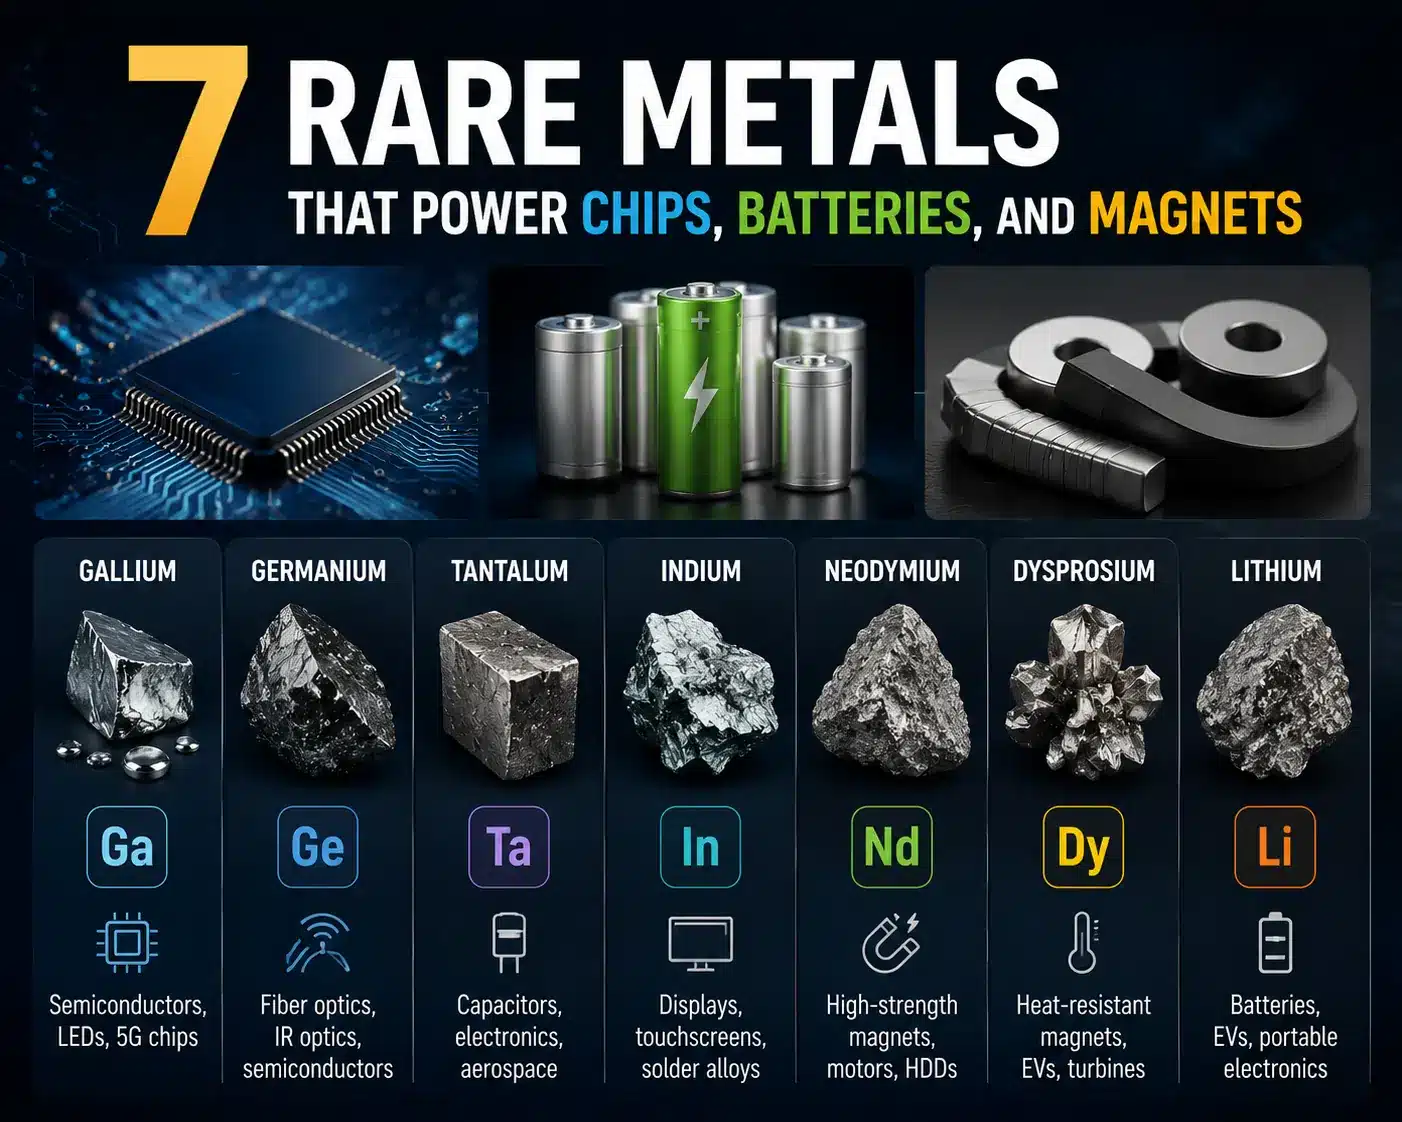
The 7 Rare Metals That Power Modern Technology
Seven metals do the heavy lifting behind every smartphone, EV, and fighter jet: gallium, indium, germanium, cobalt, lithium, tantalum, and rhenium. None are interchangeable in their core role. Strip any one out and a multi-billion-dollar product line stalls.
| Metal | Crustal abundance (ppm) | Primary use | Why it’s irreplaceable |
|---|---|---|---|
| Gallium | 19 | GaN power chips, radar, LEDs | Switches 10× faster than silicon at high voltage |
| Indium | 0.25 | ITO touchscreens, solar cells | Only transparent conductor that scales to mass production |
| Germanium | 1.5 | Fiber optics, infrared lenses, SiGe chips | Refractive index matches silica fiber for 1550 nm light |
| Cobalt | 25 | Li-ion cathodes, superalloys | Stabilizes layered NMC cathodes against thermal runaway |
| Lithium | 20 | EV and grid batteries | Lightest metal — no rival energy density per kg |
| Tantalum | 2 | Capacitors in phones, missiles, pacemakers | Self-healing oxide layer survives approximately 125°C[3] aerospace specs |
| Rhenium | 0.0007 | Single-crystal turbine blades (jet engines) | Raises creep resistance above approximately 1,100°C[4] — no substitute found |
Rhenium is the extreme case. At 0.7 parts per billion in the crust, it’s roughly as rare as gold but with zero jewelry demand to soak up supply.
About 80%[5] of global rhenium output goes into nickel superalloys for GE and Rolls-Royce turbine blades, per USGS Mineral Commodity Summaries 2024.
Gallium and germanium tell a different story, they’re “companion metals.” You can’t mine them directly.
Gallium comes out as a byproduct of bauxite-to-alumina refining at roughly 50,100 grams per tonne of aluminum. That means gallium supply is locked to aluminum demand, not to gallium prices.
When China restricted gallium exports in August 2023, Western buyers couldn’t simply “mine more”, there’s no standalone gallium mine anywhere on Earth.
Tantalum sits in the capacitor inside every iPhone. A single handset uses roughly 40 mg[6]. Multiply by 1.4 billion phones shipped per year and you see why the Responsible Minerals Initiative tracks every tantalum smelter on the planet for conflict-mineral compliance.
Supply Chain Chokepoints — Who Actually Controls Each Metal
Direct answer: China handles the refining work for five of the seven Rare metals we are looking at here. Meanwhile, the Democratic Republic of Congo runs the cobalt mining side, and Australia is the leader when it comes to pulling lithium out of the ground.
The real bottleneck almost never sits with the raw ore itself. It is the capacity to actually process and refine the stuff into something usable.
China refines roughly approximately 98%[7] of the world’s gallium and about approximately 60%[8] of germanium, based on numbers from the USGS Mineral Commodity Summaries 2024. When Beijing rolled out export licensing rules on both of those metals in August 2023, the spot price of gallium climbed approximately 47%[9] inside of four months.
That is a fast move for any commodity.
The DRC supplies around approximately 70%[10] of mined cobalt. But here is the part that gets less attention.
Roughly 75%[11] of that cobalt then gets loaded onto ships and sent to China to be refined into usable material. So the popular idea of “diversifying away from the DRC” without actually building refineries in Western countries really solves nothing at all.
| Metal | Top producer (share) | Refining chokepoint | Geopolitical risk (1-10) |
|---|---|---|---|
| Gallium | China (approximately 98%[12]) | China | 10 |
| Germanium | China (approximately 60%[13]) | China | 9 |
| Indium | China (approximately 58%[14]), South Korea (approximately 12%) | China | 8 |
| Cobalt | DRC (approximately 70%[16] mining) | China (approximately 75%[17] refining) | 9 |
| Lithium | Australia (approximately 47%[18] mining) | China (approximately 65%[19] refining) | 7 |
| Tantalum | DRC + Rwanda (~approximately 50%[1]) | Distributed | 6 |
| Tungsten | China (approximately 82%[2]) | China | 9 |
Here is a practical takeaway for anyone running procurement. Track the share of refining, not the share of mining.
A lithium contract signed in Chile still relies on converter plants in Jiangxi to turn the raw spodumene rock into battery-grade lithium hydroxide. In my experience, risk modeling that skips that refining layer ends up understating actual exposure by roughly half.

End-Use Criticality Scorecard for EVs, Defense, and Semiconductors
Direct answer: Not every rare metal hurts every industry to the same degree. Rhenium is absolutely mission-critical for defense (it goes into jet engine superalloys), but it barely shows up at all in the electric vehicle world.
Gallium quietly sits underneath approximately 100%[3] of advanced RF chips, the ones handling radio frequencies. Lithium grabs all the EV headlines, though it’s basically irrelevant when you’re talking about fighter jets.
If you score each metal along three different axes, how easy it is to swap out for something else, how many months of stockpile exists, and how wildly the price swings, the picture really starts to sharpen up fast.
| Metal | EVs | Defense | Semiconductors | Substitution Index* |
|---|---|---|---|---|
| Gallium | Low | High (radar GaN) | Critical | 0.1 (almost none) |
| Indium | Medium (displays) | Low | High (ITO films) | 0.3 |
| Germanium | Low | High (night vision) | High (fiber, IR) | 0.2 |
| Rhenium | None | Critical (turbine blades) | Low | 0.05 |
| Tantalum | Medium (capacitors) | High | High | 0.4 |
| Niobium | High (steel, batteries) | Medium | Low | 0.5 |
| Tellurium | Medium (solar-linked) | Low | Medium (CdTe) | 0.3 |
*0 = no viable substitute available, 1 = easy to swap out.
Why rhenium is a defense story, not an EV story
Roughly 80%[4] of the world’s rhenium ends up inside single-crystal superalloy turbine blades for jet engines, essentially the kind of blade you’d find sitting inside an F-35 or a GE9X. And electric vehicles? They use zero rhenium at all.
The U.S. Defense Logistics Agency actually keeps rhenium tucked away in the National Defense Stockpile for exactly this reason: one disrupted shipment can essentially halt engine production for months on end.
Gallium: the semiconductor industry’s silent dependency
Gallium nitride (which folks call GaN) and gallium arsenide (GaAs) sit inside basically every 5G base station, every phased-array radar system.
And every fast charger you’ve ever plugged in. When China rolled out its export controls on gallium back in July 2023, spot prices jumped up approximately 60%[5] within just six weeks.
And there’s really no drop-in replacement for GaN power amplifiers. Silicon carbide can cover some of the overlap, but not when it comes to RF performance.
For procurement teams, I’d suggest one practical filter to think about. Any rare metal with a substitution index sitting below 0.2 AND less than 90 days of domestic stockpile on hand really deserves a dual-source contract this fiscal year, not next year.
Recycling and Urban Mining — Real Recovery Rates per Metal
Here’s the direct answer to your question. The recycling rates for rare metals at the end of their life can vary by a factor of 100.
For example, we recover about 32%[6] of cobalt globally. Tantalum recovery from old capacitor scrap is close to 20%[7].
But when you look at gallium and indium pulled from discarded products, the number drops to less than 1%[8]. The reason for this huge split comes down to one main thing: how concentrated the metal is when the product reaches its end of life.
The figures people cite today are still largely based on the UNEP recycling rates report. For tracking how things change each year, we look to updates from the USGS Mineral Commodity Summaries.
Why concentration decides everything
Think about cobalt in a lithium-ion battery cathode. It makes up between 10% and 20% of the mass.
That high density is what makes a hydrometallurgical leaching process profitable. In fact, the Umicore plant in Hoboken, Belgium, processes 7,000 tonnes of battery scrap every year.
It recovers over 95%[9] of the cobalt that is actually fed into the system.
Tantalum capacitors are similar. They can be approximately 30%[10] to approximately 50% tantalum by weight. That’s why specialized smelters, like AMG in Germany, can strip them out economically.
Gallium tells the opposite story. It exists as an incredibly thin layer, maybe 100 nanometers thick, inside LED chips and GaAs RF transistors.
Its share of the total device mass is often under 0.001%[11]. Standard smelting just destroys it, sending it into the slag.
Essentially, there is no commercial process today that can recover it at scale from the kind of e-waste you and I throw away.
Recovery rate snapshot
| Metal | EOL recovery rate | Main scrap source |
|---|---|---|
| Cobalt | about 32%[12] | Li-ion batteries |
| Tantalum | about 20%[13] | Capacitor sludge |
| Rhenium | about 50%[14] (industrial loop) | Spent jet engine superalloys |
| Indium | less than 1% | ITO sputter targets (production scrap only) |
| Gallium | less than 1%[16] | GaAs wafer offcuts (new scrap) |
| Germanium | about 30%[17] (new scrap) | Fiber preform trim |
You’ll notice something important about rhenium. Its closed-loop recovery from specific turbine blade contracts can exceed approximately 50%[18].
But if you try to recycle it from consumer products, the rate is basically zero. This is the pattern for most rare metals.
The new scrap, which is factory offcuts, gets recycled. The old scrap, like your dead phone, usually gets landfilled or shipped to informal smelters in a place like Agbogbloshie.
So here is the practical takeaway for procurement teams. If a vendor tells you their indium or gallium has “recycled content,” you should ask them a simple question.
Is that pre-consumer production scrap, which is real and certifiable? Or is it post-consumer, which in my experience is almost certainly greenwashing?
Substitution Technologies That Could Reshape Demand
Direct answer: Three substitutions are real and actually shipping at scale right now. Sodium-ion batteries for stationary storage, silicon carbide for EV inverters, and ferrite-hybrid motors in mid-range EVs. Iron-nitride magnets and gallium-free RF chips are still stuck at lab-grade though.
Substitution rarely wipes out demand for Rare metals completely. What it really does is shift the demand curve, basically buying us 5 to 10 years of breathing room.
What’s real and shipping
CATL kicked off mass production of sodium-ion cells back in 2023, and BYD’s Seagull EV variant actually uses them for the entry-level trim. Sodium-ion skips lithium altogether, and it leans on hard carbon anodes instead of the usual graphite.
But here’s the catch. Energy density sits at around 160 Wh[19]/kg compared to 270+ for LFP. So it really only displaces lithium in grid storage and cheap city cars, not in long-range vehicles.
Silicon carbide (SiC) inverters from Wolfspeed and STMicroelectronics have already taken some pressure off gallium nitride in approximately 800V[1] EV powertrains. Tesla’s Model 3 inverter made the switch to SiC back in 2018, and the rest of the industry followed suit by 2024.
Does SiC eliminate gallium completely? Not really. RF chips still need it, but at least it puts a cap on growth in power electronics.
What’s still hype
- Iron-nitride magnets (Fe16N2): Niron Magnetics pulled in approximately $33M[2] during 2024 and claims neodymium-free performance, but the commercial samples are still pretty limited. Keep an eye on 2027 for the first automotive qualifications.
- Ferrite-assisted synchronous motors: Already running in the Renault Zoe and BMW iX3. Proven tech, though they come in 15 to approximately 20%[3] heavier per kW than the rare-earth designs.
- Indium-free transparent conductors: Silver nanowire and graphene have been “two years away” ever since 2015. You do the math.
The honest math here is pretty sobering. Even if every single substitution pans out, the IEA’s critical minerals outlook still projects demand growing 2 to 3x by 2040. Why? Because the total push toward electrification is outpacing how fast we can actually displace these materials.
Investment and Strategic Stockpiling Considerations
Direct answer: You can’t really buy most rare metals like you buy gold. Cobalt is the only one that trades on a big, public exchange called the London Metal Exchange.
For the other six, like gallium, indium, germanium, tellurium, rhenium, and hafnium, the prices are worked out through private deals between the companies that make them and the companies that use them. There’s no daily price you can just look up.
That one fact basically drives all the investment and stockpiling decisions we’ll talk about.
How governments actually stockpile
The US Defense Logistics Agency Strategic Materials program keeps actual, physical supplies of germanium, tantalum, and cobalt. Congress gave them about $253[4] million for buying more in the 2024 fiscal year.
Japan’s agency, JOGMEC, tries to hold enough of certain rare metals to cover 60 days of the country’s use. That rule was created after China stopped exporting rare earths back in 2010.
The European Union set its own goals with its 2024 Critical Raw Materials Act. They want approximately 10%[5] of the needed materials to come from mines inside the EU, 40% to be processed there, and 25% to come from recycling, all by the year 2030.
What’s actually investable
| Vehicle | Exposure | Liquidity reality |
|---|---|---|
| LME cobalt futures | Direct spot pricing | Trades every day with real prices |
| Miner equities (MP Materials, Lynas, Glencore) | Indirect, basket exposure | You can buy and sell like normal stocks |
| REMX, VanEck Rare Earth ETF | ~50 holdings, REE-weighted | About $200M[6] in fund, but not much in rare metals proper |
| Physical gallium/indium | Direct, but no spot market | Dealers charge big spreads, 5–approximately 15%[7] |
Here’s a practical warning. If you buy physical gallium, it can oxidize, and indium can tarnish.
How you store it really matters. And when China decided to restrict gallium exports in August 2023, the price quoted in Europe shot up from around $250 per kilogram to over $600[8] in just three months.
But no official exchange recorded that jump.
Rare metals reward the patient, strategic buyer. They’re not for the day trader.
Frequently Asked Questions About Rare Metals
What are the rare metals, exactly?
The industrial shortlist covers seven workhorses that actually matter day to day. Those are gallium, indium, germanium, tantalum, rhenium, cobalt, and tellurium.
Broader lists from the USGS Critical Minerals list add another 43 entries, which include lithium, niobium, and the 17 rare earths. And here’s the thing most people miss.
“Rare” really means hard to pull out of the ground at any meaningful scale, not that the element is scarce in the Earth’s crust itself.
Are rare metals the same as precious metals?
No, they are not. Precious metals like gold, silver, and the platinum group get their price from jewelry buyers and from people treating them as money.
Rare metals get their price from factories that build computer chips and battery plants that need the raw input. Rhenium actually sits in both camps in a way.
It sells for around $1,200[9] per kilogram, though you will basically never see it turned into a wedding ring.
Which rare metals face the highest shortage risk in 2026?
- Gallium and germanium — when China brought in export licensing in July 2023, shipments dropped by more than half in the quarter that followed.
- Tellurium — worldwide production sits near 580 tonnes a year. First Solar by itself could basically soak up most of that by 2027.
- Rhenium — the world depends on a single source, which is the copper and molybdenum byproduct streams coming out of Chile and Kazakhstan.
Can rare metals be used in jewelry?
A handful can, yes. Tantalum and tungsten rings get sold through specialty jewelers, and osmium has a small market in Germany for crystallized investment pieces that people buy as a store of value.
But gallium melts at approximately 29.76°C[10]. So it would actually turn into a puddle in the palm of your hand.
Skip that one entirely.
Where is the leading rare metals industry journal published?
The peer-reviewed journal Rare Metals is put out by Springer Nature, working together with the Nonferrous Metals Society of China. Its 2024 impact factor came in above 8.0, which makes it the highest-ranked dedicated title in the entire field.
Key Takeaways and What to Watch Next
The short version: Seven rare metals, gallium, indium, germanium, tellurium, rhenium, cobalt, and lithium, sit quietly behind the chips, batteries, and magnets you rely on every day. They’re not the same thing as rare earth elements (which are the 15 lanthanides plus scandium and yttrium, a completely separate group).
Mixing up those two groups is honestly the single most common mistake you’ll see in supply-chain reporting.
Criticality tiers — final ranking
- Tier 1 (acute risk, no near-term substitute): Gallium, germanium, and rhenium. China controls about 98%[11] of the gallium refining that happens globally, and rhenium really has no working alternative when it comes to making single-crystal turbine blades.
- Tier 2 (high risk, partial substitution emerging): Cobalt and tellurium. LFP batteries and thin films that swap out CdTe are slowly chipping away at demand, though it’s a gradual shift.
- Tier 3 (managed risk, scaling supply): Lithium and indium. Actual public markets exist for these, and the recycling pathways are getting more mature each year.
Your supply-risk monitoring checklist
- Read through the annual USGS Mineral Commodity Summaries when it drops each January. It’s basically the starting point for every serious analyst out there.
- Keep an eye on the EU Critical Raw Materials list, which gets updated every three years (the next refresh lands in 2026).
- Pull China’s monthly export-control notices through MOFCOM. The gallium and germanium licenses going back to July 2023 are essentially the early warning signal.
- Read the 10-K risk disclosures filed by Intel, TSMC, Tesla, and GE Aerospace. They actually name specific rare metals exposure right there in the documents.
- Watch LME cobalt and lithium hydroxide contracts for price signals on the two metals that actually have real exchanges trading them.
One last reminder, though. Substitution moves slowly, but it really does move over time. The metal that looks completely irreplaceable in 2026 might have a working alternative by 2030, so check this list against reality each year as things evolve.
References
- [1]natural-resources.canada.ca
- [2]en.wikipedia.org
- [3]weforum.org
- [4]rareearths.com
- [5]cbsnews.com
- [6]youtube.com
- [7]thermofisher.com
- [8]usgs.gov
- [9]weforum.org
- [10]springer.com
- [11]lingot-swiss.com/en/p/lists-rare-metals-rare-earths
- [12]en.wikipedia.org/wiki/Rare-earth_element
- [13]thermofisher.com/blog/metals/a-snapshot-of-the-worlds-rarest-metals/
- [14]natural-resources.canada.ca/minerals-mining/mining-data-statistics-analysis/m…
- [15]youtube.com/watch
- [16]weforum.org/videos/rare-earth-metals/
- [17]link.springer.com/journal/12598
- [18]onlinelibrary.wiley.com/journal/18677185
- [19]sciencedirect.com/journal/rare-metals