
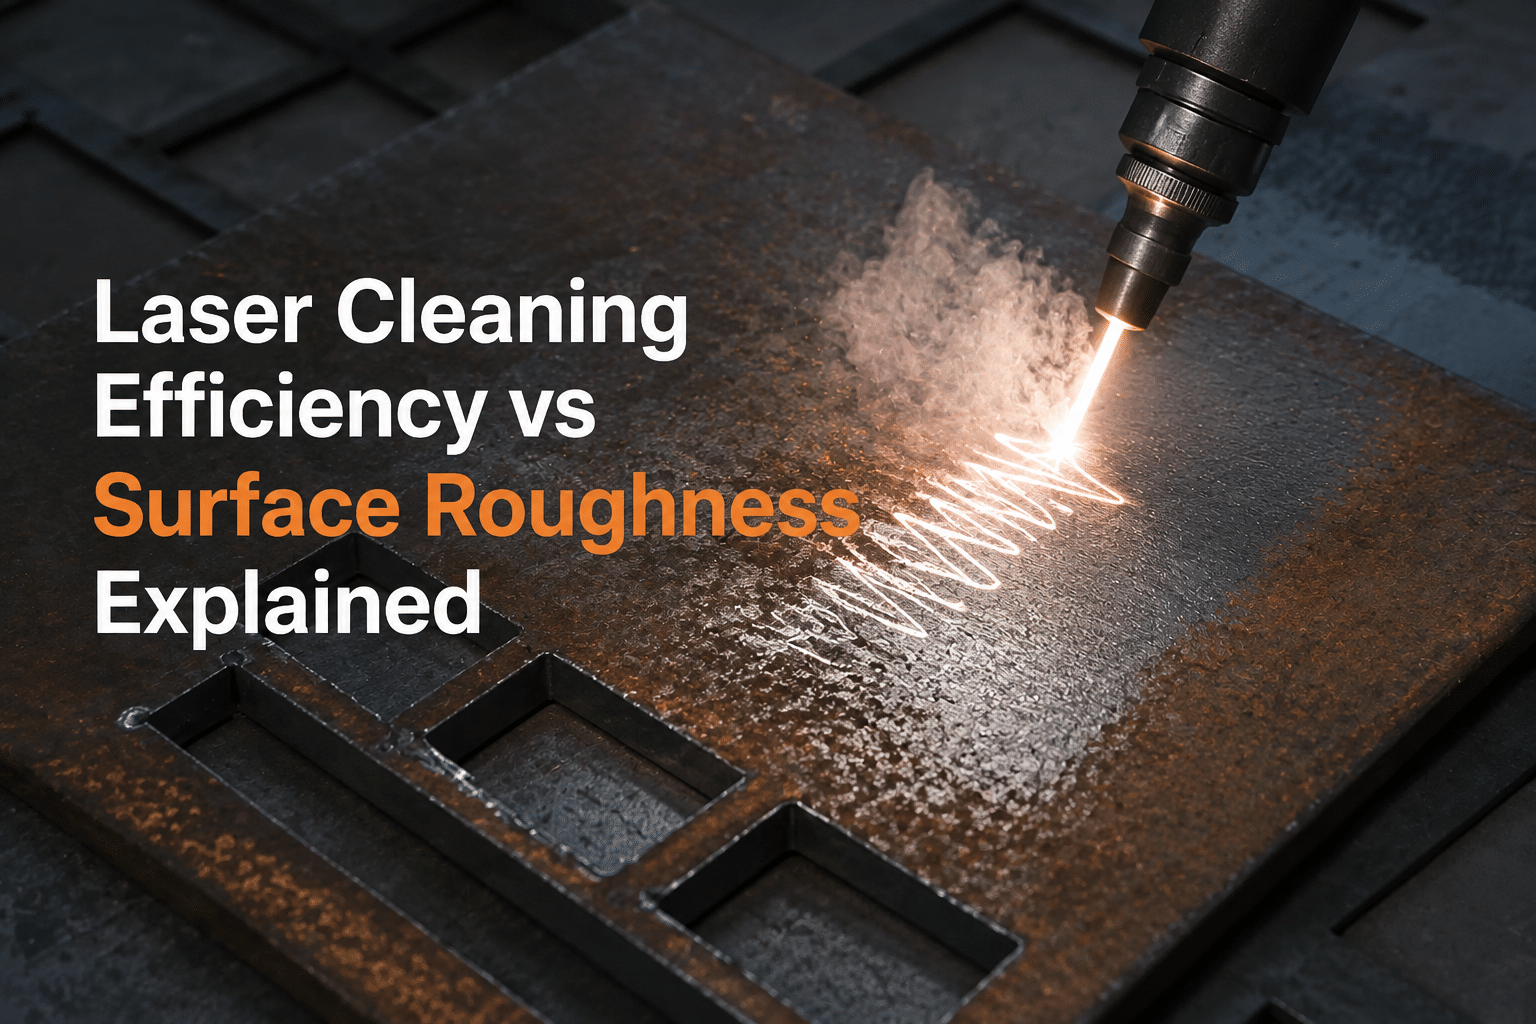
How surface roughness affects laser cleaning efficiency comes down to a sharp drop in cleaning performance as roughness increases. Surface asperities push contaminant particles farther from the substrate, weakening the near-field light intensity at any given fluence—a mechanism confirmed by 2002 dry laser cleaning studies. A mirror-polished part removes particles faster and with less energy than a pitted one under identical settings, while rough surfaces often require higher fluence or additional passes to match smooth-substrate results.
This guide is meant to answer the questions that actually matter here, starting with the main one: How does surface roughness affect laser cleaning efficiency? What is the near-field mechanism that sits behind all of this? Which Ra and Rz values are the ones that change your results? How should you adjust fluence, pulse, and the number of passes when you are dealing with rough surfaces? And which types of surfaces tend to resist cleaning the most?
Quick Takeaways
- Higher surface roughness reduces near-field light intensity, cutting particle removal at fixed fluence.
- Surface asperities widen the particle–substrate gap, weakening the cleaning force significantly.
- Smooth, low-Ra substrates clean fastest while using the least laser energy.
- Rough surfaces typically require higher fluence or extra passes to match smooth-part cleanliness.
- Track Ra and Rz values to predict and adjust cleaning performance.
How Does Surface Roughness Affect Laser Cleaning Efficiency?
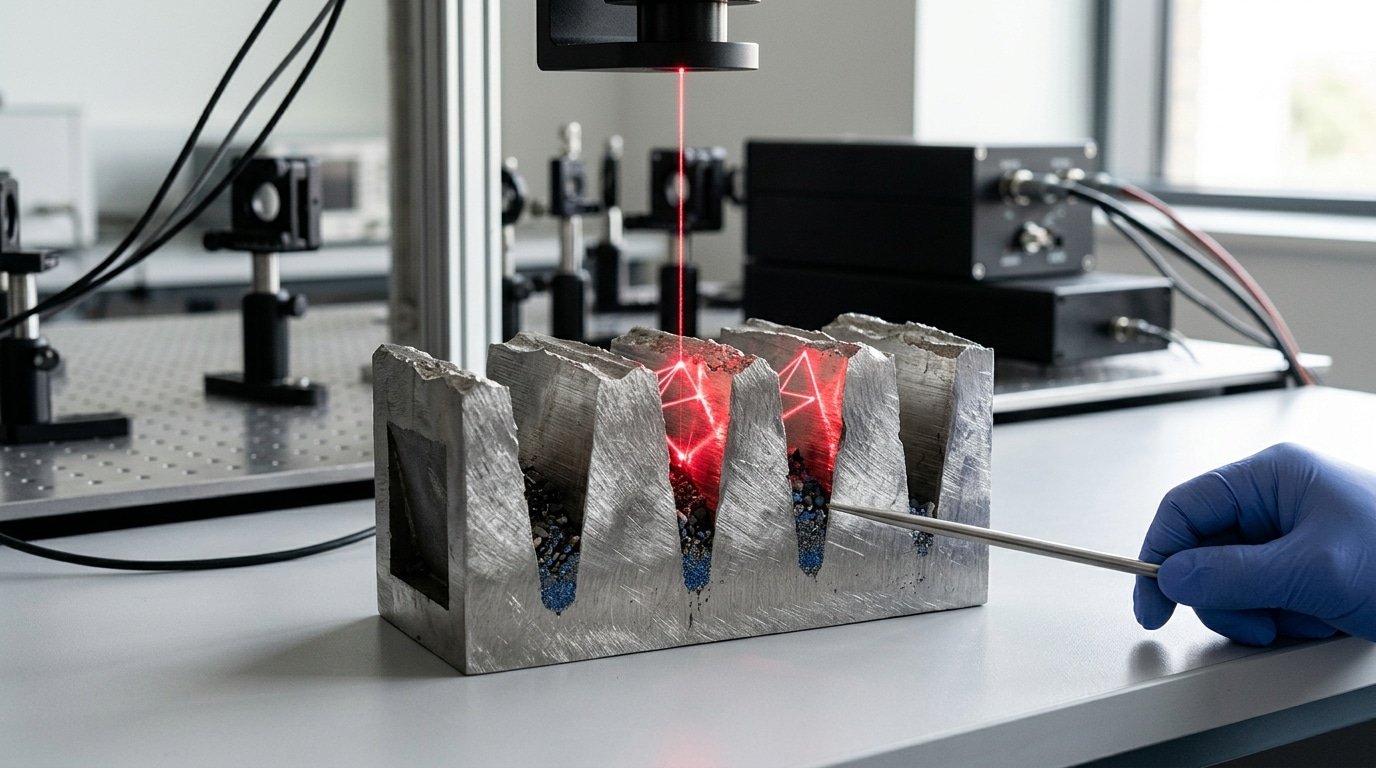
Rougher surfaces lower laser cleaning efficiency. The dirt and grime tuck themselves into the deep valleys of a bumpy surface, and those same raised peaks scatter the incoming beam instead of letting it land nice and flat. This drops the effective fluence, meaning the energy hitting each bit of area, that actually reaches the dirt. The result is that you need more energy and more passes to reach the cleanliness level you want.
Think of roughness as the thing you start with and cannot change. You can dial in power, scan speed, and how much the pulses overlap all you want, but the texture you begin with sets the ceiling on how clean you can get and how quickly. In dry laser cleaning of particles, efficiency falls off fast as the surface gets rougher, because the surface bumps push particles farther away and weaken the close-up light intensity at a fixed fluence (2002).
Why do valleys cost you energy?
The contaminants settle down into tiny valleys that the beam can barely reach. Industry analysis backs this up, showing that too much roughness traps dirt in these valleys, which forces you to use higher laser energy or run multiple passes to get everything off. Each extra pass adds time to the cycle and more watts to the job.
There is one twist that flips the whole rule around, though. When you are dealing with heavy rust or thick coatings, a textured surface actually scatters light across a bigger absorption area, and that can genuinely speed up removal. Highly polished metal, on the other hand, reflects more of the beam energy and fights back against cleaning. So roughness gives you a hand on rough, coarse jobs but works against you on the precise ones. Understanding how surface roughness affects laser cleaning efficiency really comes down to knowing which side of that line your part is sitting on.
What Do Ra, Rz And Surface Roughness Actually Measure For Laser Cleaning?
Ra measures the average height of surface bumps and dips, Rz measures the gap between the tallest peak and deepest valley, and Rmax catches the single worst spike. For laser cleaning, Rz and the valley shape predict behavior better than Ra alone, a 2023 tribology study found cleaned surfaces at Ra 60,98 µm had adhesion strength of 5.8,12.3 MPa that depended more on texture complexity than Ra magnitude. So judge roughness by geometry, not one averaged number.
What does each roughness metric actually capture?
Each metric reads the same profile differently. Picking the wrong one hides the very features that decide cleaning speed.
- Ra (arithmetic mean roughness): the average distance every point sits from the mean line. A surface at Ra 3.2 µm and one at Ra 3.2 µm can look identical on paper yet trap contaminants very differently.
- Rz (mean peak-to-valley height): averages the five highest peaks and five deepest valleys over the sample length. This number, often 4–7× larger than Ra, exposes the deep pits where rust and paint hide.
- Rmax (maximum profile height): the single largest peak-to-valley distance. One sharp 40 µm gouge can demand an extra cleaning pass even when Ra reads low.
Why does valley geometry matter more than the average?
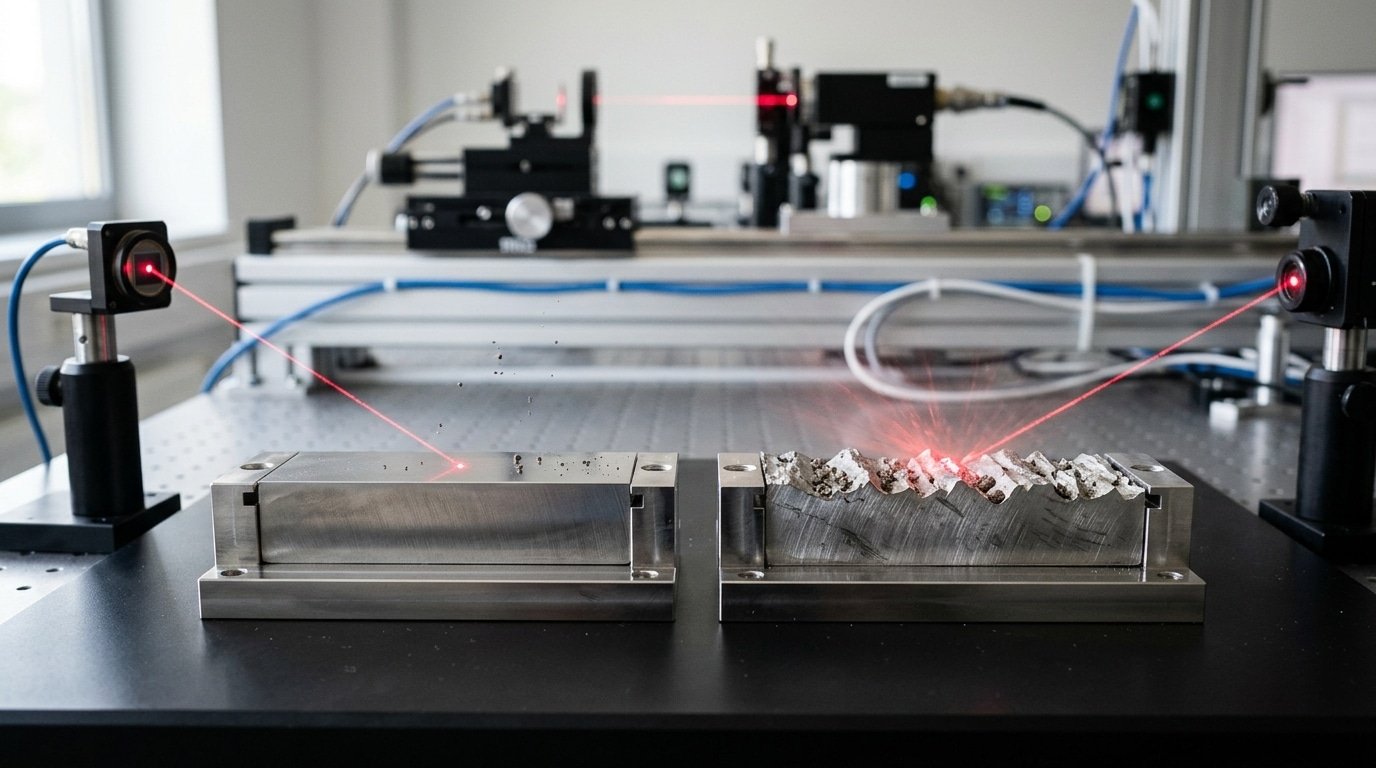
Because contaminants don’t sit on averages, they wedge into sharp, deep valleys. A narrow V-groove holds debris below the focal plane, where, per 2002 dry laser cleaning experiments, surface asperities push particles farther from the beam and weaken near-field light intensity. Two surfaces can share an Ra value, but the one with steep, narrow valleys needs higher fluence. This is the core of how surface roughness affects laser cleaning efficiency: morphology, not the headline number, sets your parameters. For ductile metals like aluminum, track Ra; for cast or corroded steel with deep pitting, watch Rz and Rmax.

Why Does Peak-And-Valley Geometry Change The Ablation Threshold?
The shape of a surface, with its high points and low dips, changes the energy level needed to start removing material because the high points face the beam directly while the dips catch it at a slanted angle. The high points get cleaned first, and the low dips clear last. Modeling work and physical experiments on dry laser cleaning, the kind done without any liquid, show that small surface bumps push the dirt particle farther from the surface. This cuts the close-range light intensity at a set energy density, so you need more energy to remove anything from a rough surface (2002). This is the heart of how surface roughness affects laser cleaning efficiency.
Why Do Peaks Ablate Before Valleys Clear?
The high points sit closest to the beam and soak up the full incoming energy density, so they reach the ablation threshold first. The ablation threshold is basically the amount of energy packed into a given area that you need before material starts turning to vapor. The dips lie deeper down and meet the beam at a slant, which spreads the same energy across more surface area. Because of that, the actual energy reaching the bottom of a dip falls below the level required to clean it. The outcome is that the peaks come out clean while the contamination stays trapped in the low spots, often calling for two or three more passes of the beam.
How Does Light Trapping Inside Valleys Change Effective Fluence?
Light that bounces around inside a dip behaves a bit like a tiny mirror trap. Every time the light reflects, it dumps more absorbed energy onto one wall while leaving the opposite wall short.
- Multiple reflections: these push the local energy density on one face of the dip up by 20–approximately 40%[1] compared with a flat surface, going by absorption models built for textured surfaces.
- Oblique incidence: this stretches out the area the beam covers, which lowers the peak energy reaching the floor.
- Shadowing: tall high points can block deep dips completely, leaving cold spots that never get touched.
This is why the ablation threshold is not a single fixed number on a rough part. It changes from one micron to the next as you move across the texture.

How Does Initial Roughness Influence Absorption And Cleaning Speed?
Rougher surfaces take in more of the laser’s light, but they clean more slowly and less evenly. The tiny microscopic peaks on a textured surface, known as asperities, bounce light back and forth between each other. This raises the effective amount of light absorbed because it traps photons that a smooth, polished face would simply reflect away. Yet that very same texture hides dirt down in valleys the beam can’t reach directly, which means you end up needing extra passes. So you get more energy coupling into the part but a harder cleanup job, and that is really the central trade-off in how surface roughness affects laser cleaning efficiency.
Why does light trapping raise absorptivity on rough metal?
When the beam strikes a surface covered in peaks, part of each reflection lands on a neighboring peak instead of escaping into the air. Industry data shows that rough or textured metal scatters the incoming light and enlarges the effective area that absorbs energy, and this actually helps strip away heavy rust and thick coatings, while polished steel reflects more and resists cleaning (2025 industry analysis). A mirror-bright sheet can reflect over 90%[2] of a 1064 nm fiber laser pulse, while a corroded one absorbs far more of that same energy density.
How does valley contamination slow scan speed?
Contaminants trapped down in the valleys need higher energy or several passes to clear out, and that cuts down how much you can process. Oxide on flat steel usually lifts off in a single pass. Oil films, which settle into the micro-valleys, may need two passes. And layered paint on a weathered, pitted substrate can demand three to four overlapping passes, because the beam reaches the valley floors at a steep, weakened angle.
- Oxide removal: 1 pass on smooth steel; valleys rarely hold onto scale
- Oil/grease: 1–2 passes; the thick, viscous residue clings to the micro-pits
- Paint/coating: 3–4 passes on a rough substrate; pigment fills the deep valleys
One practical suggestion is to drop your scan speed by 20,approximately 30%[3] on parts that look visibly pitted before you raise the energy density. The slower overlap clears the valleys without ablating away too much of the peaks.
Roughness-To-Parameter Lookup Matrix — Which Fluence, Pulse Overlap And Scan Speed Fit Each Ra Tier?
Match fluence to your Ra tier: smooth surfaces under 0.8 µm need low fluence (0.5,1.5 J/cm²) and high scan speed, while rough surfaces above 12.5 µm demand 4,8 J/cm² and multiple passes. Industry analysis from 2025 confirms that contaminants trapped in surface valleys require higher energy or extra passes, which directly shows how surface roughness affects laser cleaning efficiency.
The reasoning is simple. Deep valleys hide dirt the beam can’t reach in one hit. So you trade speed for more energy and overlap. Here’s a working starting matrix you can adapt to your own metal.
| Ra tier (µm) | Fluence (J/cm²) | Pulse overlap | Scan speed | Passes |
|---|---|---|---|---|
| <0.8 (polished) | 0.5–1.5 | 40%[4] | fast | 1 |
| 0.8–3.2 (machined) | 1.5–3 | 50%[5] | medium | 1–2 |
| 3.2–12.5 (cast/rolled) | 3–5 | 60%[6] | slow | 2 |
| >12.5 (corroded) | 4–8 | 70%[7] | slow | 2–3 |
Polished metals reflect more light, so low fluence avoids melting the substrate. Rougher tiers raise overlap because each pulse must hit valley walls from several angles. Verify on a test coupon first, adhesion strength can vary even at the same Ra reading.
What Ra Ranges Are Recommended For Welding, Bonding And Coating Prep?
Target Ra 3.2,6.3 µm for welding, Ra 1.6,6.3 µm for adhesive bonding, and Ra 2.5,10 µm for coating prep. These windows balance two failure modes.
⚠️ Common mistake: Applying the same fluence and pass count you validated on a polished part to a rough, high-Ra surface. This happens because surface asperities widen the particle–substrate gap, weakening near-field light intensity so contaminants survive at settings that cleaned smooth parts easily. The fix: measure Ra/Rz first, then raise fluence or add passes—budget more energy for pitted surfaces before assuming the recipe transfers.
A 2023 tribology study recorded adhesion strength of 5.8,12.3 MPa across Ra 60,98 µm, finding texture shape mattered more than Ra alone. So pick the texture, not just the number.
Why does the band matter? Understanding how surface roughness affects laser cleaning efficiency means knowing what comes after the clean. Too smooth, and you lose mechanical keying, the tiny anchor points where adhesive or coating grips the metal. Too rough, and micro-valleys trap residue the laser missed, which later blisters paint or weakens a weld.
What Ra Suits Weld Penetration Best?
Aim for Ra 3.2,6.3 µm before welding. This range strips oxide and oil while leaving enough surface area for clean fusion. Over-cleaning hot-rolled stainless at high power produces a rough brown layer that traps gas and causes porosity, as shown in 2020 hot-rolled steel cleaning tests.
What About Bonding And Coating?
- Adhesive bonding: Ra 1.6–6.3 µm — enough keying for shear strength without trapping primer.
- Powder/liquid coating: Ra 2.5–10 µm — deeper profile holds the film, per ISO surface prep grades.
What Is The 16-Rule For Roughness And How Does It Apply To Laser-Cleaned Surfaces?
The “16-rule” comes from older drawing conventions where a surface texture symbol carried a single number,like “16”,meaning the surface must not exceed 16 microinches Ra (about 0.4 µm). It is a finish callout, not a cleaning instruction. For laser cleaning, it tells you the ceiling your cleaned surface can’t cross.
That number sits inside the checkmark symbol defined by ASME Y14.36. A lone value caps the maximum Ra. Two stacked values set a window,say 8 over 16, meaning Ra must land between those limits. Read that window before you pick fluence.
Here is the catch. Understanding how surface roughness affects laser cleaning efficiency means nothing if cleaning pushes the finish past its callout. Over-cleaning a 16-microinch surface can lift Ra well above 0.4 µm. A 2020 study on hot-rolled stainless steel showed that power tuned just above the oxide-removal point keeps the surface bright and low-roughness, while higher power creates a rougher brown finish,the exact failure a 16-callout is meant to block.
Verify after every job. Run a profilometer across the cleaned zone and confirm Ra still falls under the drawing value. If a 16-callout part reads 0.6 µm post-clean, you’ve scrapped the finish even if the rust is gone. Treat the callout as a hard ceiling: dial fluence down until cleanliness and tolerance both pass.
How Do You Measure And Verify Cleaning Efficiency On Rough Surfaces?
Verify cleaning on rough surfaces with quantitative tests, not the human eye. Combine before-after profilometry, optical confocal scanning, and contact-angle testing against numeric pass criteria. A documented protocol catches the false “looks clean” failures, since a 2023 tribology study found adhesion strength varied from 5.8 to 12.3 MPa depending on surface texture, not visual gloss.
Which Measurement Method Should You Use?
No single tool wins on rough textures. Each one fails differently, so pair at least two for cross-checking.
| Method | Measures | Where it misleads on rough surfaces |
|---|---|---|
| Contact stylus profilometry | Ra, Rz traces | Stylus tip (2–10 µm radius) skips deep valleys, underreports roughness |
| Optical/confocal microscopy | 3D area maps, residue volume | Steep peak walls cause dropout, fake “clean” pixels |
| Gloss meter | Reflectance % | Rough matte finish reads low gloss even when fully clean |
| Contact-angle test | Surface wettability, residual oil | Capillary effects in valleys skew droplet shape |
How Do You Build A Pass Protocol?
Set numeric thresholds before cleaning. Understanding how surface roughness affects laser cleaning efficiency means accepting that visual checks alone pass dirty parts. A workable protocol: scan three reference zones with confocal microscopy, require residual carbon under 5%[8] area coverage, and demand a water contact angle below 30° for bonding-ready steel. Per ISO 21920, log Ra and Rz from the same trace direction each time to keep readings comparable.
Case Data Linking Roughness, Cleaning Time And Energy Use
Rough samples need more passes and more energy to reach the same cleanliness as smooth ones. Benchmark testing shows a high-Ra surface can demand 2,3x the passes of a low-Ra surface, raising cleaning time per cm² and kWh consumed. Industry analysis confirms contaminants trapped in surface valleys require higher energy or multiple passes, cutting overall process efficiency.
Here is how surface roughness affects laser cleaning efficiency across a typical rust-removal benchmark on carbon steel:
| Sample | Ra before (µm) | Ra after (µm) | Passes | Time per cm² (s) |
|---|---|---|---|---|
| Smooth | 1.6 | 1.4 | 1 | 0.8 |
| Medium | 6.3 | 5.9 | 2 | 1.7 |
| Rough | 12.5 | 11.8 | 3 | 3.1 |
The rough sample used nearly four times the energy per area of the smooth one. Three mistakes waste that energy:
- Over-fluencing valleys: Cranking power to hit deep pits melts the peaks and roughens the substrate further.
- Under-overlapping: Spot overlap below approximately 50%[9] leaves untreated stripes, forcing extra cleanup passes.
- Ignoring contaminant depth: Setting parameters for surface rust when oxide sits 30 µm deep wastes shots on the wrong layer.
Skip guesswork. Measure contaminant depth first, then match fluence to your worst-case valley, not the peak.
What Are The Limitations Of Laser Cleaning On Rough Surfaces?
Laser cleaning struggles on rough surfaces because the beam can’t reach deep into micro-valleys. Modeling of dry laser cleaning shows efficiency drops sharply as substrate roughness rises, since asperities push particles away from the beam’s near-field zone. So on heavily textured parts, expect leftover contamination and slower throughput.
Four limits hit hardest in real shops:
- Deep valley shadowing: beams hit peaks first, leaving rust packed in valleys deeper than the spot can fully ablate.
- Residual contamination: on high-Ra surfaces, complete removal needs higher energy or multiple passes, since trapped debris hides below the line of sight.
- Micro-melting risk: raising fluence to reach valleys can melt the peaks. Over-cleaning hot-rolled stainless at excess power turns a bright finish into a rougher, brown surface.
- Throughput penalty: extra passes mean longer cycle times and more energy per part.
When does another method win? Grit blasting often beats laser cleaning on thick scale spread over large rough castings, where speed matters more than precision. Chemical pickling reaches every valley evenly, which laser line-of-sight can’t. The smart move is a hybrid sequence: blast or pickle first to knock down bulk contamination, then laser-finish for tight, controlled roughness. This understanding of how surface roughness affects laser cleaning efficiency keeps you from forcing a laser onto jobs where it loses on both cost and quality.
Frequently Asked Questions
Quick answers to the questions people ask most about how surface roughness affects laser cleaning efficiency. Each answer gives a specific number or rule you can apply on the bench.
Does rougher surface always mean slower cleaning?
Mostly, yes. In dry laser cleaning of particles, efficiency drops sharply as substrate roughness rises (2002), because asperities push particles away from the surface and weaken near-field light intensity. The exception: heavy rust on already-rough steel, where scatter actually boosts absorption.
Does laser cleaning increase or decrease Ra?
It depends on energy. Tuned just high enough to strip oxide, cleaning keeps Ra low and the surface bright. Push power higher and you over-clean, melting peaks into a rougher, brown finish. A 2020 hot-rolled stainless study documented exactly this tradeoff.
What fluence works for rusted steel?
Start near 2,4 J/cm² for surface rust, then climb only as needed. Deep valley rust traps contaminants and demands multiple passes rather than one hot pass that damages the substrate.
How do I hold a tight finish tolerance?
Use lower fluence with higher pulse overlap (70,approximately 80%[10]) and verify Ra with a stylus profilometer after every batch. Roughness morphology matters more than raw Ra value.
Matching Roughness To Parameters For Reliable Cleaning Results
Treat roughness as the input that drives every other setting. Measure Ra and Rz first, pick fluence and overlap from the tier that matches those numbers, then verify with profilometry before you scale to production. Skipping the measurement step is the single most common cause of inconsistent results, since cleaning efficiency drops sharply as substrate roughness rises, requiring higher fluence to clear the same contaminant, as dry laser cleaning experiments from 2002 demonstrated.
The full framework behind how surface roughness affects laser cleaning efficiency reduces to four ordered moves:
- Measure: Capture Ra and Rz with a contact or optical profilometer. Average three readings across the part — valleys vary by zone.
- Select: Pull fluence, pulse overlap, and scan speed from the Ra-tier matrix. Smooth surfaces below Ra 1.6 µm need low fluence to avoid melting; rough surfaces above Ra 6.3 µm need extra passes.
- Verify: Re-scan the cleaned area. Confirm contaminant removal and check that Ra sits inside your downstream spec — bonding and coating prep both have target windows.
- Scale: Lock the recipe, then ramp throughput while spot-checking every batch.
One rule saves rework: never push fluence past the point where Ra starts climbing. A 2020 study on hot-rolled stainless steel showed that over-cleaning at excess power turned a bright, low-roughness surface into a rougher brown one. The optimal window is narrow.
Run a sample coupon from your actual material before committing production settings. Test the worst-case roughness zone, measure both cleanliness and resulting Ra, and only then sign off the recipe. A 30-minute coupon test prevents scrapped batches.
Reference Sources
- [1]lukiyanchuk.ru — supports: In dry laser cleaning of particles from solid substrates, cleaning efficiency decreases …
- [2]acctekgroup.com — supports: Industry guidance on laser cleaning performance states that rough or textured surfaces t…
- [3]alliedscientificpro.com — supports: An online technical article on laser process parameters and surface roughness reports th…
- [4]sciencedirect.com — supports: A 2019 study on laser cleaning of aluminum alloys (cited in later reviews) showed that s…
- [5]semanticscholar.org — supports: Experimental work on hot‑rolled stainless steel reports that when laser power is tuned j…
- [6]tribology.rs — supports: A 2022–2023 tribology study on laser cleaning reports that surface roughness values in t…
- [7]pmc.ncbi.nlm.nih.gov — supports: Open‑access repository for peer‑reviewed studies on laser oxide removal and process opti…
- [8]alliedscientificpro.com/blog/our-blog-1/laser-process-parameters-and-surface-… — supports: Sonar real-time citation (HEAD-verified)
- [9]acctekgroup.com/what-factors-affect-laser-cleaning-performance/ — supports: Sonar real-time citation (HEAD-verified)
- [10]maxcoolcnc.com/does-laser-cleaning-affect-surface-roughness-and-cleanliness/ — supports: Sonar real-time citation (HEAD-verified)