

Steel-on-Steel Coefficient of Friction: Dry, Lubricated and Test-Ready Values
There is no single coefficient for every steel-on-steel contact. For a rough dry screen, historical points are about 0.74–0.78 static and 0.42–0.57 sliding; lubricated values can be much lower. Treat those numbers as test-specific references, then define the surfaces, load, motion, lubricant, temperature and method before a design release.
Oceanplayer Laser Technical Team · Engineering reference · Updated September 2026

What coefficient should you use for steel-on-steel contact?
Start with the question your design must answer. The table below gives a safe next step, the evidence needed to support it, and the point where a handbook value must stop.
| Design situation | Reasonable first step | Evidence to collect | Stop boundary |
|---|---|---|---|
| Dry preliminary sizing | Screen a broad range such as µ 0.4–0.8. | Grade, hardness, finish, load, motion and dwell. | Do not release a critical design from a copied table cell. |
| Oiled or greased contact | Model start-up and running separately. | Exact product, amount, viscosity, temperature, supply and test window. | “Lubricated” alone is not a reproducible condition. |
| Drive or actuator sizing | Calculate breakaway and running force, then add non-friction loads. | Force trace, acceleration, guides, seals, alignment and uncertainty. | Do not size from nominal µ if peak force or stick-slip is unknown. |
| Holding or safety function | Use a qualified lower-bound value and positive restraint where required. | Representative worst-case tests, scatter and applicable code review. | Friction alone is not a safety safeguard for a suspended or personnel load. |
Swipe horizontally to read all decision columns.
How do you choose a starting value?
For an early dry-contact calculation, do not hide uncertainty behind one decimal. A practical first pass is to examine roughly 0.4 to 0.8, then replace that broad envelope with test data that matches the real parts. The historical NASA points below help explain the scale of dry friction; they are not a material certificate or a guaranteed range.
For a lubricated contact, model start-up and steady running separately. Low speed, cold temperature, long dwell or weak lubricant supply may leave the surfaces in boundary lubrication. At higher speed, a mixed or full fluid film may change the loss mechanism, so a fixed Coulomb coefficient may no longer be the right model.
Choose the conservative direction by the failure. Use a qualified lower-bound coefficient when loss of grip is dangerous. Use a qualified upper-bound value when motor force, heat, wear, galling or seizure is the concern.
How do dry, oiled and greased steel contacts compare?
These representative points show the scale of possible results. They are useful for sensitivity checks, not for a drawing, purchase order or safety calculation without a matched test.
| Contact condition | Static / breakaway | Sliding | How to use it |
|---|---|---|---|
| Dry mild steel on mild steel | ≈ 0.74 | ≈ 0.57 | Historical NASA handbook point for preliminary sensitivity—not a guaranteed grade range. |
| Dry hard steel on hard steel | ≈ 0.78 | ≈ 0.42 | Shows that “hard steel” still has different starting and running behavior. |
| Greasy hard steel on hard steel | Several points ≈ 0.11–0.23; special films lower | Several points ≈ 0.029–0.12 | The grease, film and test differed. Do not average these into one property. |
| Greasy mild steel on mild steel | Not given in the cited row | ≈ 0.09 or 0.19 | Two lubricant-dependent points show why the exact formulation matters. |
| Air-cleaned steel with thin oxide film | Test-specific | Maximum ≈ 0.54 in one NASA test | Not a value for rusted, scaled or black-oxide parts in general. |
| Exceptionally clean steel in vacuum | Application-specific | Values as high as 3.5 reported | An edge case showing that a coefficient can exceed 1 when adhesion becomes severe. |
Primary value sources: NASA RP-1228 and NASA SP-36. RP-1228 reproduces compiled historical handbook points rather than one modern controlled steel-friction study. ASTM G115-24 explains why a friction result must include the full tribosystem and reporting conditions.
How should you calculate breakaway and running force?
Use a simple coefficient model to see sensitivity, then add acceleration, guides, seals, alignment and uncertainty before selecting hardware.
Use this calculator to explore force, holding margin or an inclined-plane result. It is a sensitivity tool, not a safety approval or replacement for testing.
The same model predicts 4.00 kN after sliding begins. Add acceleration, alignment, seal, guide and uncertainty loads before selecting an actuator.
The Coulomb model is a first estimate. Run-in, temperature, lubricant starvation, corrosion and stick-slip can move the real force outside it.
What do static, kinetic and breakaway friction mean?
The coefficient is dimensionless. It relates tangential resistance to the normal force pressing the surfaces together—but only under the defined contact state.
Fs,max = µs × NStatic friction adjusts from zero up to this limit. It is not always equal to µsN while the part is still.
Fk ≈ µk × NState whether µk is initial, average, peak or steady-state and define the averaging window.
P = µk × N × vThis is mechanical dissipation. Heat splits between both parts, lubricant, debris and surroundings.
µs = tan(θ)At 30°, the calculated static coefficient is about 0.577 for that tested rider and plane.
If no tangential force is applied, friction can be zero. Static friction grows only as needed to oppose the applied force, up to the breakaway limit. This distinction prevents oversized loads and incorrect free-body diagrams.

The real contact area is much smaller than the apparent area. Local pressure flattens asperities, breaks surface films and can form tiny adhesive junctions. Sliding must shear those junctions while peaks and particles plough the other surface.
“Dry” should mean no intentionally applied liquid or grease. It does not mean chemically bare: ordinary steel still has oxide, adsorbed water, cleaning residue, fingerprints or preservative unless the process controls them.
Why does the same steel pair produce different friction results?
A short test can miss the most important state. Record force against time, distance or cycles so start-up, run-in, stable motion and degradation stay visible.
What changes while the parts wait?
Oil can squeeze away, grease can migrate, corrosion can form and asperity junctions can strengthen.
How is the first movement captured?
Measure the first macroscopic motion with a defined force ramp and movement threshold.
How do the surfaces run in?
Peaks flatten, debris moves and protective or transfer films begin to form.
Which window should be reported?
Report mean, range and spikes for the exact interval used in the calculation.
When does the contact start to fail?
Starvation, temperature, contamination or wear may push friction upward before seizure.
A high breakaway-to-running drop can combine with low drive speed, structural compliance, backlash and control response to create chatter, squeal, banding or position error. A lubricant change may help, but guidance design, stiffness, preload, alignment and motion control may also need attention.
How do lubrication regimes change steel-on-steel friction?
Lubrication can separate asperities, carry heat, transport debris and form low-shear surface films. The operating regime—not the label on the container—determines what resists motion.
What happens in boundary lubrication?
Much of the load remains on asperities. Friction depends on surface chemistry, additives, pressure, temperature, dwell and replenishment.
What happens in mixed lubrication?
Fluid carries part of the load while asperities carry the rest. Roughness, speed, viscosity and starvation all matter.
What happens in full-film lubrication?
Loss comes mainly from fluid shear, inlet and outlet flow, seals and churning. A constant steel-on-steel Coulomb µ is misleading here.
When do EHL and starvation matter?
Pressure changes viscosity and elastically deforms surfaces. Weak supply can move the contact back toward mixed or boundary operation.
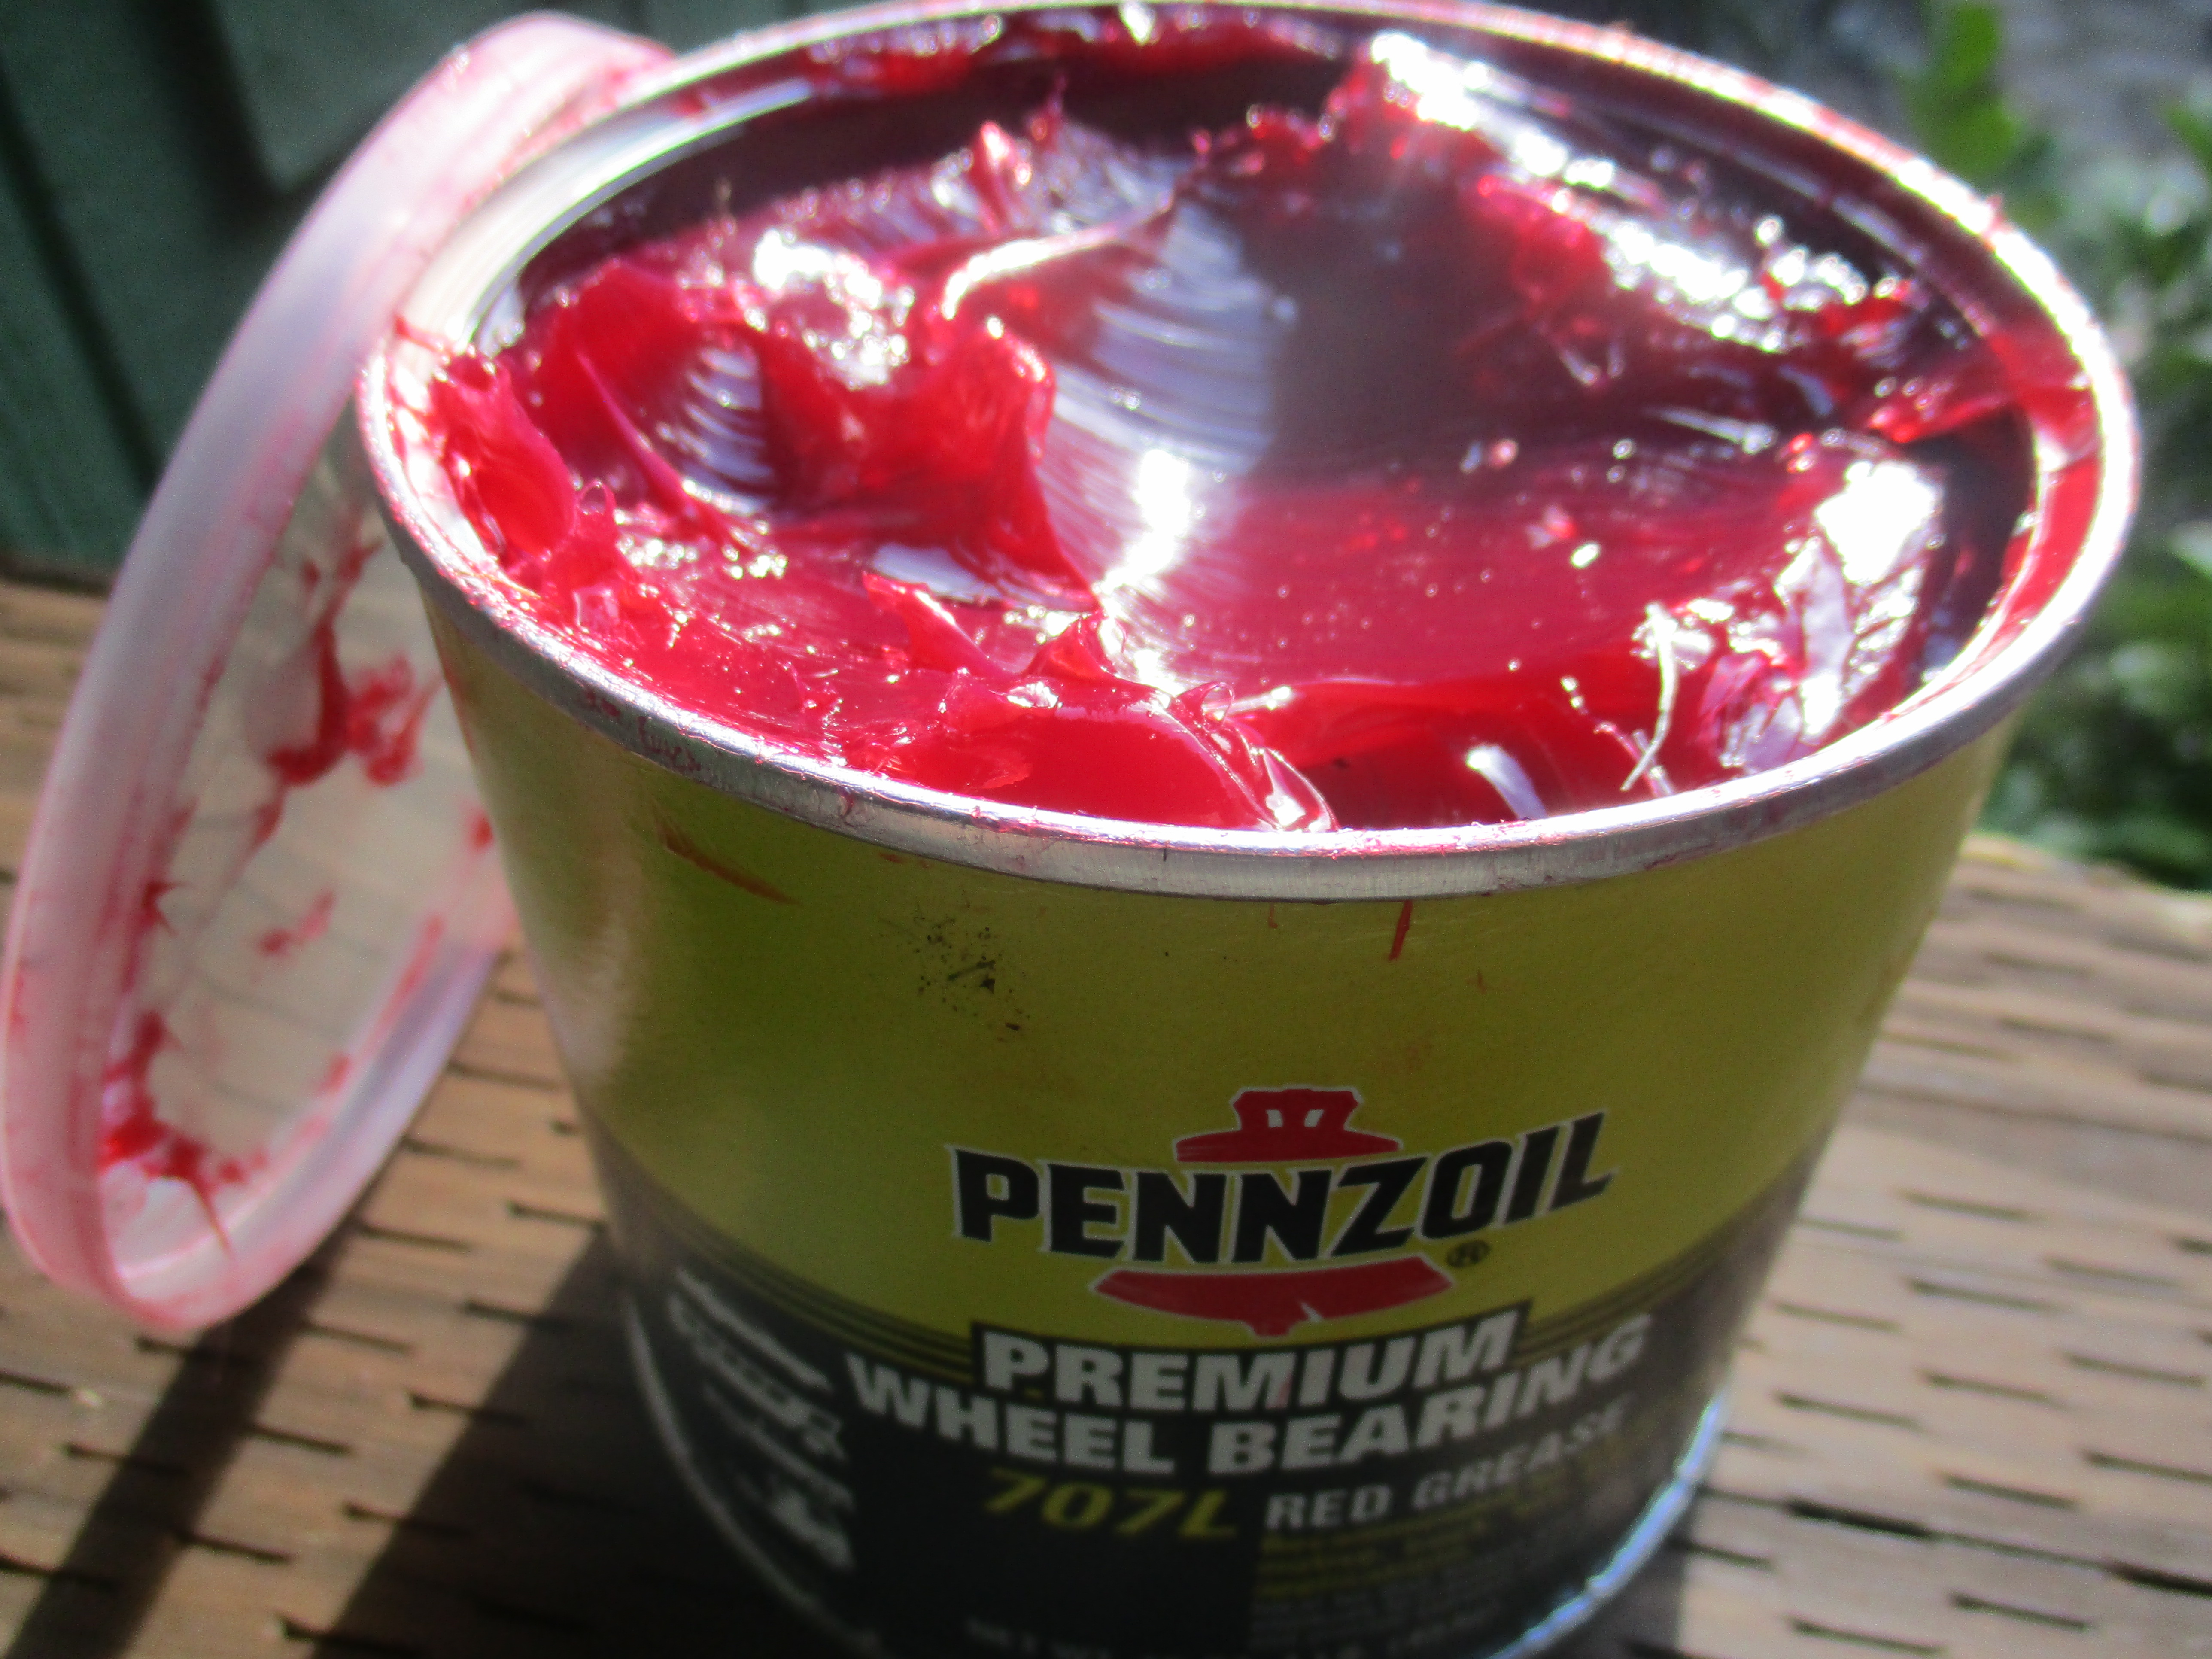
Oil can circulate, cool and filter, but supply and leakage need control. Grease stays near the contact and can help exclude contamination, yet it may channel, bleed, age or fail to replenish a repeatedly swept path.
- Identity: exact commercial product, revision, base oil, viscosity and additives.
- Application: quantity, fill, flow, placement and relubrication interval.
- Temperature: cold-start torque, warm running viscosity and high-temperature aging.
- Contamination: particles, water, cleaner residue and mixed-product compatibility.
How do load, roughness, hardness and direction change friction?
Before comparing two coefficients, normalize the full test description. ASTM G115 exists because much published friction data cannot be reused when these details are missing.
Does rougher steel always mean more friction?
Not always. Roughness can increase ploughing, interlocking and film collapse, but a very smooth, clean, similar-metal pair can also increase adhesion. Directional lay and lubricant retention can matter more than one Ra value.
Does harder steel always mean less friction?
Hardness may reduce penetration and grooving, but it does not define oxide stability, additive response or adhesive shear strength. A hard rough tool can still plough a softer steel, and two hard clean steels can still gall.
Does low friction mean low wear?
Coefficient of friction describes force. Wear describes material loss or damage. A contact can slide easily while a hard particle cuts the surface, or show high friction while a protective film limits long-term wear.

Microscopy, debris and a force trace are more useful together than a single average coefficient.
Image: Du Xiaodong et al., Wikimedia Commons, CC BY 4.0. This is impact-corrosion wear, not the dry sliding test behind the handbook values.
Pitting, scuffing, abrasive grooves and transferred metal require different corrective actions.
Photo: Simiprof, Wikimedia Commons, CC0 1.0. Pitting shown as a damage example, not proof of a specific coefficient.How should you diagnose a changing steel-on-steel contact?
Friction is an early signal, but the visible surface and operating history tell you what is happening.
How does the machine function change the friction requirement?
The correct metric changes with the machine function. Rolling contacts, threads and slip-critical joints should not inherit a flat sliding coefficient without validation.

Rolling bearings combine rolling, small amounts of sliding, elastic contact, lubricant film behavior, cage interaction, seals and churning. Their total friction is not predicted by multiplying a generic steel coefficient by the bearing load.
Use the manufacturer’s bearing model and test evidence for the actual speed, load, clearance, lubricant and temperature. Check start-up separately because the contact may pass through boundary or mixed lubrication before a full film develops.
Photo: Toshinori Baba, Wikimedia Commons, public domain.How should you qualify a steel-on-steel friction value?
Start with the decision and the dangerous direction. End with a qualified range, not a copied table cell.
Define the function
Is the contact meant to hold, slide, transmit torque, guide, form or dissipate energy?
Name the risk
Decide whether low friction, high friction, heat, stick-slip, wear or seizure is more dangerous.
Define both surfaces
Give grade, hardness, treatment, finish, oxide, cleaning and storage condition.
Map the duty
Record load, pressure, speed, stroke, reversals, dwell, cycles and lifecycle state.
Control environment
Specify lubricant, amount, temperature, humidity, water, particles and atmosphere.
Screen a range
Use a broad envelope to expose sensitivity before final parts and data are available.
Test and qualify
Match the fixture to service, retain the trace and set statistical acceptance limits.
Use both bounds
Lower bound for grip; upper bound for drive force, heat and damage—when applicable.
Which friction test matches your engineering decision?
No single ASTM method represents every steel contact. Use the standard’s current purchased text, then document every intentional modification.
| Method | Best use | Useful result | Main limitation |
|---|---|---|---|
| ASTM G115-24 | Selecting and reporting friction measurements | Minimum tribosystem context and reusable reporting | A guide; it does not assign a steel coefficient. |
| ASTM G219-24 | Static breakaway using an inclined plane | µs = tan(angle at first macroscopic motion) | Rider, plane, dwell, ramp and detection remain test-specific. |
| ASTM G99-23 | Unidirectional pin- or ball-on-disk wear test | Friction trace plus wear under stated conditions | Point contact and circular track may not match a flat production slide. |
| ASTM G133-22 | Reciprocating ball-on-flat testing | Wear and optional kinetic friction through reversals | Zero-speed reversals and contact pressure may differ from the machine. |
| ASTM G223 / G196 | Adhesive-wear or galling screening | Comparative damage/friction or galling ranking | Ranking is not a universal design coefficient. |
| ASTM D5183 / D5707 | Lubricating fluid or grease comparison | Friction and wear in prescribed four-ball or SRV contacts | Field relevance must be established by the user. |
| ISO or component method | Plain bearings, coated sheet or a specific product class | Application-focused result and acceptance basis | Use only when scope, material system and service match. |
What evidence should you collect when friction changes?
Changing lubricant, finish or load blindly can hide the cause and create a second failure. Start with the force trace, surface, temperature and maintenance history.
| Symptom | Likely investigation | Evidence to collect | First engineering action |
|---|---|---|---|
| High breakaway after idle | Dwell aging, corrosion, oil squeeze-out or grease migration | Breakaway versus dwell and temperature; surface photos | Reproduce worst shutdown and cold-start state. |
| Friction rises while running | Starvation, viscosity loss, heat, debris or coating breakthrough | Force, temperature, supply, wear particles and time-to-change | Stop before galling; inspect the film and surfaces. |
| Spikes and noise | Debris, misalignment, edge loading or intermittent adhesion | High-rate force trace, alignment and wear-track map | Check cleanliness and contact geometry before smoothing data. |
| Low-speed stick-slip | Breakaway drop, velocity weakening, compliance or control loop | Force and position versus time at several speeds | Test the complete drive, guidance and control system. |
| Direction-dependent drag | Surface lay, wedge geometry, debris path or asymmetric alignment | Roughness direction and bidirectional traces | Control lay and repeat the real reversal sequence. |
| Lab passes, field fails | Wrong geometry, film supply, temperature, contamination or lifecycle | Side-by-side tribosystem audit | Change the test to reproduce the field mechanism. |
| Low friction but severe wear | Abrasion, fatigue or a low-shear sacrificial layer | Mass/volume loss, microscopy and debris chemistry | Specify friction and wear limits separately. |
- Function, failure consequence and whether the dangerous direction is low or high friction.
- Both steel grades, product forms, heat treatments, hardness and microstructure basis.
- Final surface process, roughness and lay, coating or oxide, cleaner and storage time.
- Exact lubricant product, quantity, application method and replenishment plan.
- Geometry, contact area, normal-load history, nominal/contact pressure and alignment.
- Speed, stroke, reversals, acceleration, dwell, cycles, distance and movement threshold.
- Temperature, humidity, atmosphere, water, dust and contamination limits.
- Static peak, running window, maximum, wear metric, replicates, scatter and uncertainty.
Ask for the coefficient under a named test state, plus the raw trace and surface evidence needed to judge transfer to service.
What questions do engineers ask about steel-on-steel friction?
Use these answers for orientation, then test the real contact before a critical release.
What is the coefficient of friction for dry steel on steel?
There is no universal value. Historical NASA handbook points list about 0.74 static and 0.57 sliding for dry mild steel, and about 0.78 static and 0.42 sliding for dry hard steel. Use them only for screening; the actual result depends on grades, hardness, finish, oxide, load, speed, dwell, temperature and test.
What is the coefficient for lubricated steel on steel?
It can be much lower than dry friction, but “lubricated” is not a reproducible condition. Historical greasy-steel points span roughly 0.03 to 0.23 across different entries. Name the lubricant, film supply, regime, load, speed, temperature and data window before using a value.
Is static friction always higher than kinetic friction?
No. A higher breakaway peak is common because junctions strengthen during dwell, but running friction can rise with temperature, debris, surface damage, speed or lubricant failure. Measure both states through the expected lifecycle.
How do I calculate the force needed to slide steel?
For a simple first estimate, multiply the kinetic coefficient by the normal force: Fk ≈ µkN. For breakaway, use Fs,max = µsN. Add acceleration, seals, guidance, misalignment and a justified uncertainty margin before choosing an actuator.
Does rust increase steel-on-steel friction?
Not predictably. Rust can increase ploughing, break into abrasive debris or behave like loose third bodies. It is not a stable or controlled high-friction surface treatment, and it may cause high breakaway or seizure after storage.
Does polished steel always have lower friction?
No. Polishing may reduce ploughing, but very smooth clean similar metals can form more intimate adhesive contact. Finish, lay, oxide, lubricant retention, pressure and motion direction must be considered together.
Can a steel friction coefficient be greater than 1?
Yes. It is a force ratio, not a percentage. Strong adhesion, ploughing or deformation can make tangential resistance greater than normal load. NASA literature reports much higher test-specific values for exceptionally clean steel in vacuum, but those are not normal shop-floor assumptions.
Which ASTM test should I use?
Choose by the contact and decision. ASTM G219 addresses static breakaway on an inclined plane; G99 covers pin-on-disk; G133 covers reciprocating ball-on-flat; G196 ranks galling. ASTM G115 helps define and report the complete tribosystem.
Does low friction mean low wear?
No. Friction is force; wear is material loss or damage. An abrasive particle may cut efficiently at a modest coefficient, while a high-friction protective film may limit long-term loss. Specify and test both metrics.
Can handbook values be used in a final safety design?
Not by themselves. Critical holding, structural, transport or personnel-safety functions need the applicable code, positive restraint where required, production-representative testing, statistical bounds and a qualified engineering review.
Steel-on-steel friction: what should you do before release?
Oceanplayer Laser can help evaluate laser removal of rust, oxide, oil or coating when surface preparation is part of your process. Share the material, contamination, required surface result and downstream operation.
- Steel grade and heat treatment
- Rust, oxide, oil, paint or coating
- Part dimensions and contact area
- Required cleanliness or roughness
- Downstream sliding, joining or coating step
Friction data remain valid only for the stated tribosystem and test conditions. Confirm the current purchased standard, product instructions and applicable design code before release.
- NASA RP-1228, Fastener Design Manual — historical dry and greasy steel static/sliding values and fastener friction context.
- NASA SP-36, Boundary Lubrication — adhesion, films, oxidized steel, boundary lubrication and vacuum-clean examples.
- NASA RP-1126, Lubrication of Machine Elements — boundary, hydrodynamic and elastohydrodynamic regimes.
- ASTM G115-24 — selecting friction methods and reporting a complete tribosystem.
- ASTM G219-24 — static breakaway by inclined plane.
- ASTM G99-23 — pin-on-disk wear testing with optional friction measurement.
- NIST, A Tribometer for Measurements in Hostile Environments — controlled geometry, atmosphere, stress, speed and temperature.
- SKF, Understanding and Preventing Surface Distress — boundary, mixed and full-film friction plus roughness effects.